Looking for new diagrams? There is a whole new series from May 2019 onwards here!
Diagrams as featured by The New York Times!
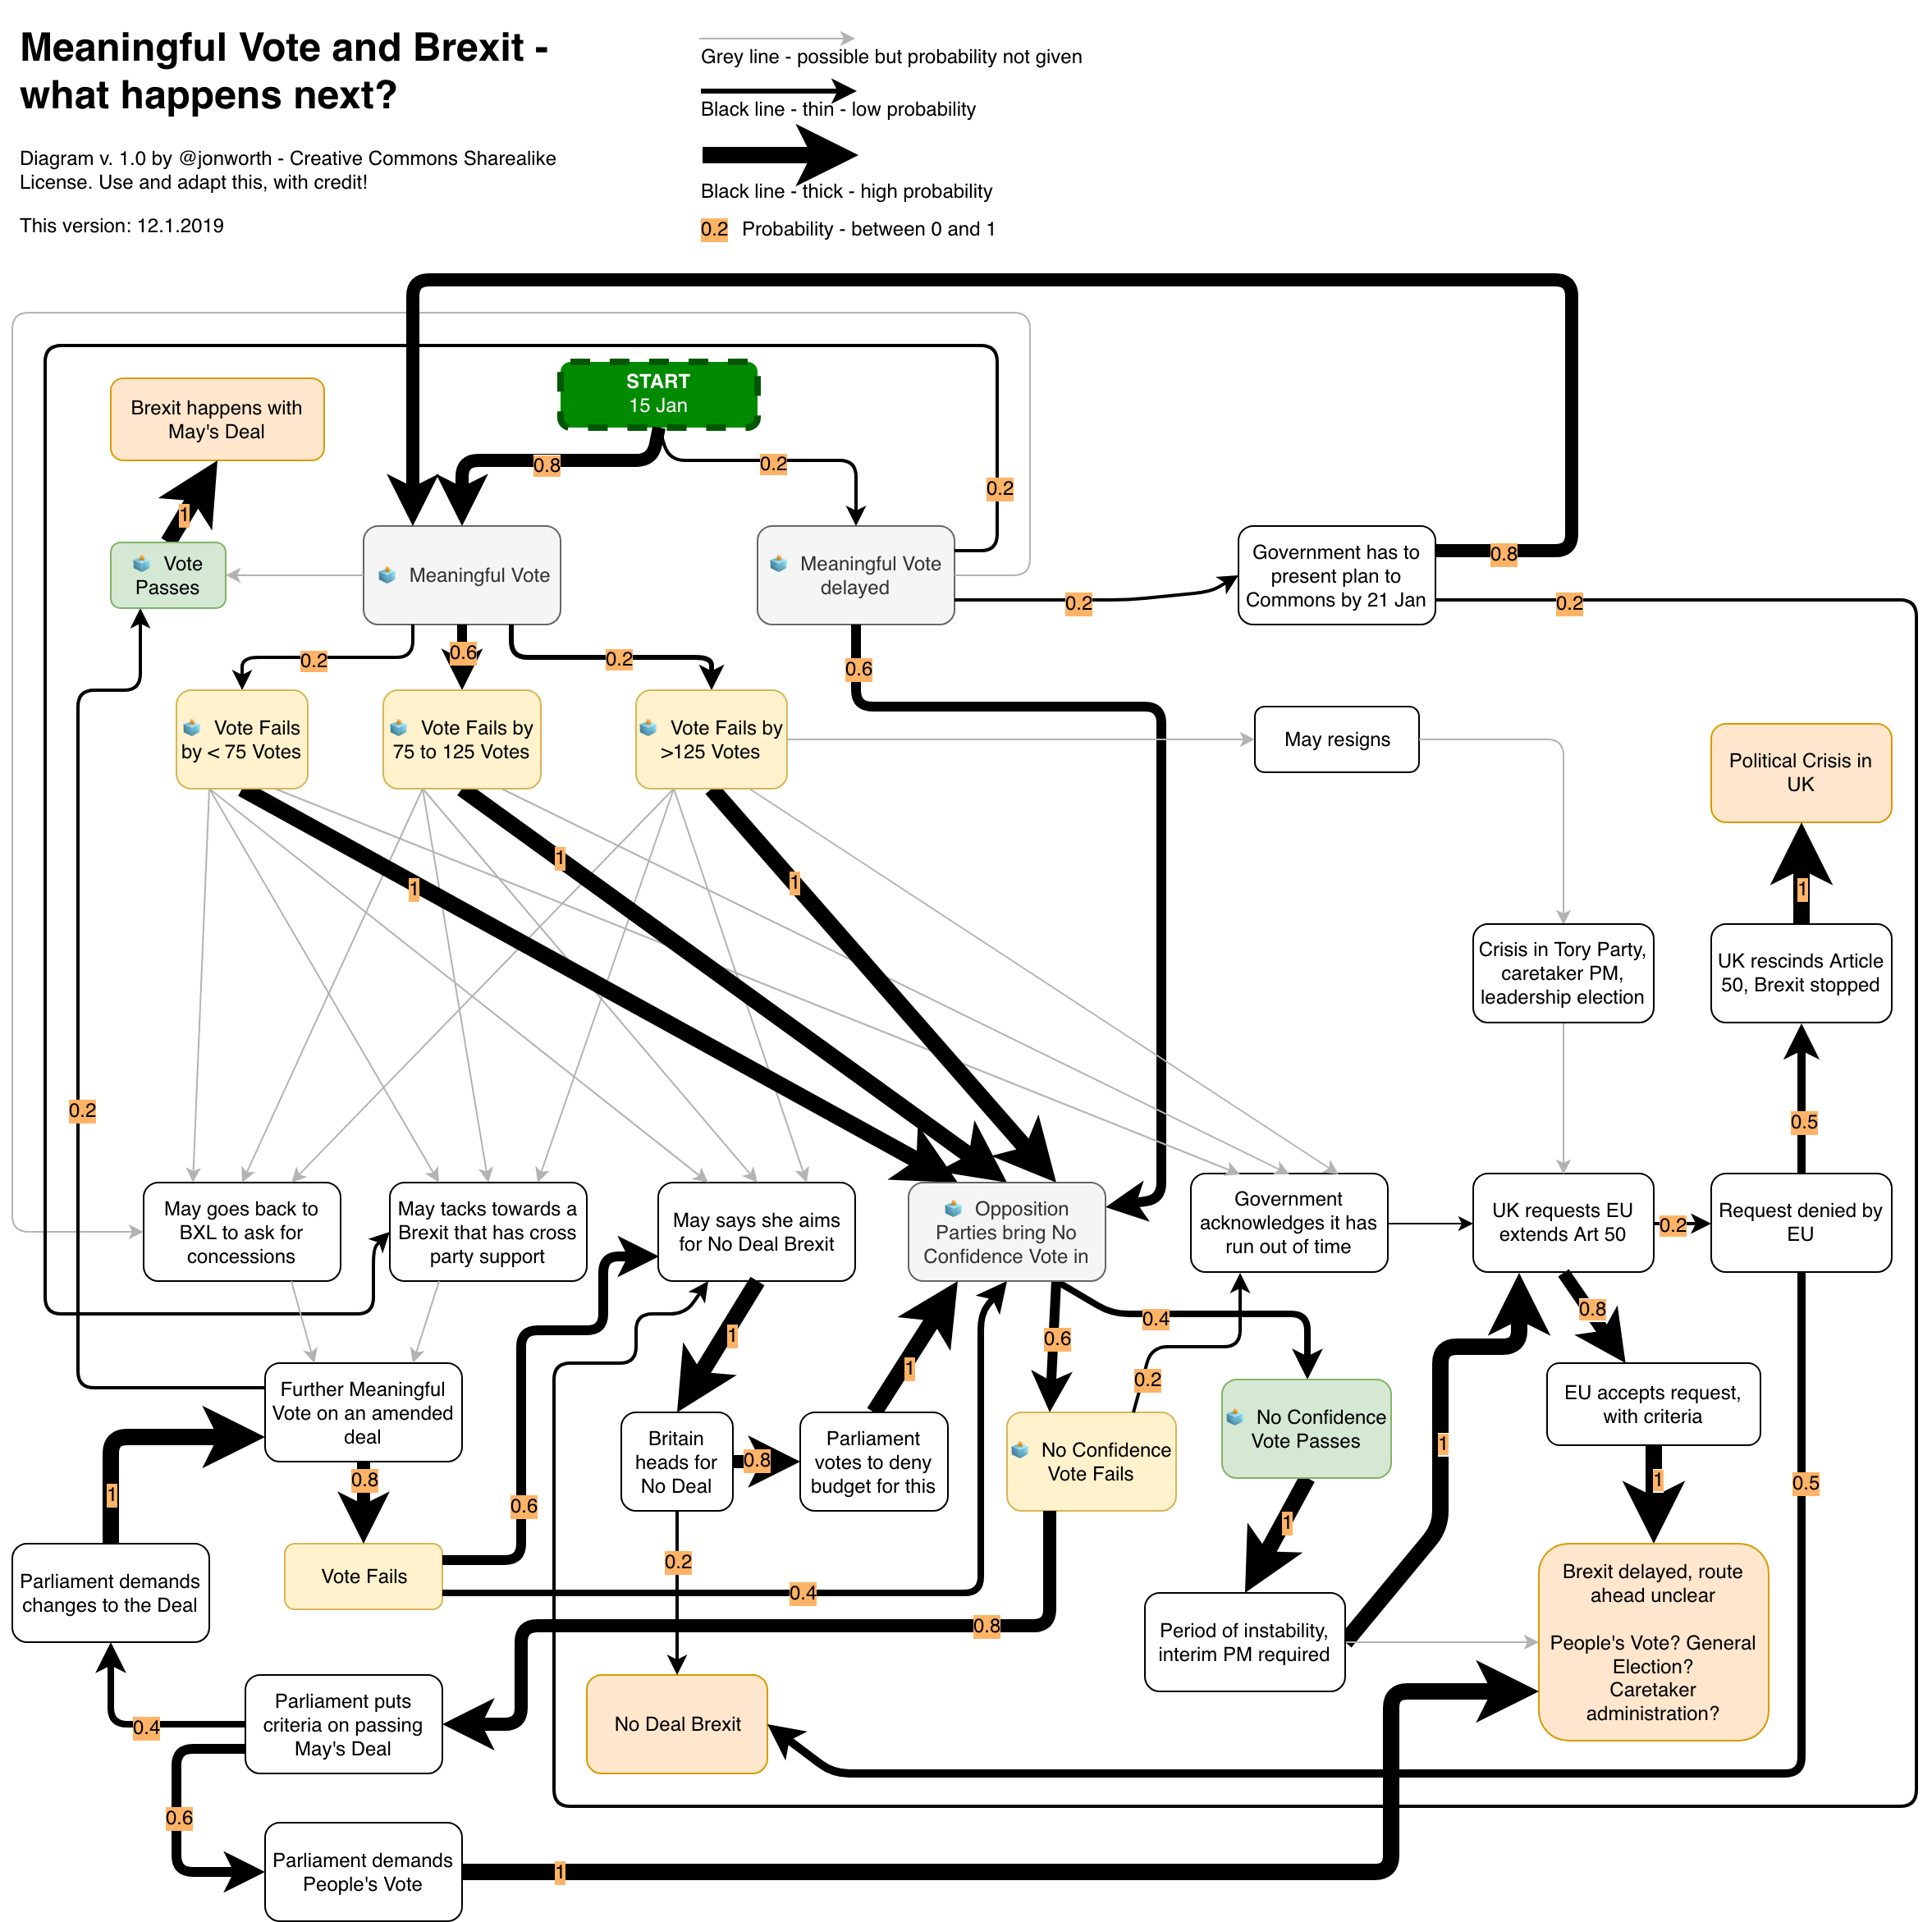
I have tried to make sense of Brexit through a series of flow diagrams that have evolved as Brexit decisions have been taken. This blog post gathers those diagrams together, the newest versions first. In each case click the image to see the full resolution version.
All diagrams are made with draw.io. If you want to use these files for your own purposes, feel free – everything is Creative Commons Sharealike licensed. Dutch news site did precisely that here!
There are two sets of diagrams – the ones around the 29th January vote on amendments to Theresa May’s Brexit plan are at the top of this post (high res versions, draw.io XML files, and probability calculations in .ods files can be found here), and the earlier ones relating to the Meaningful Vote below (high res versions and draw.io XML files of those can can be found here).
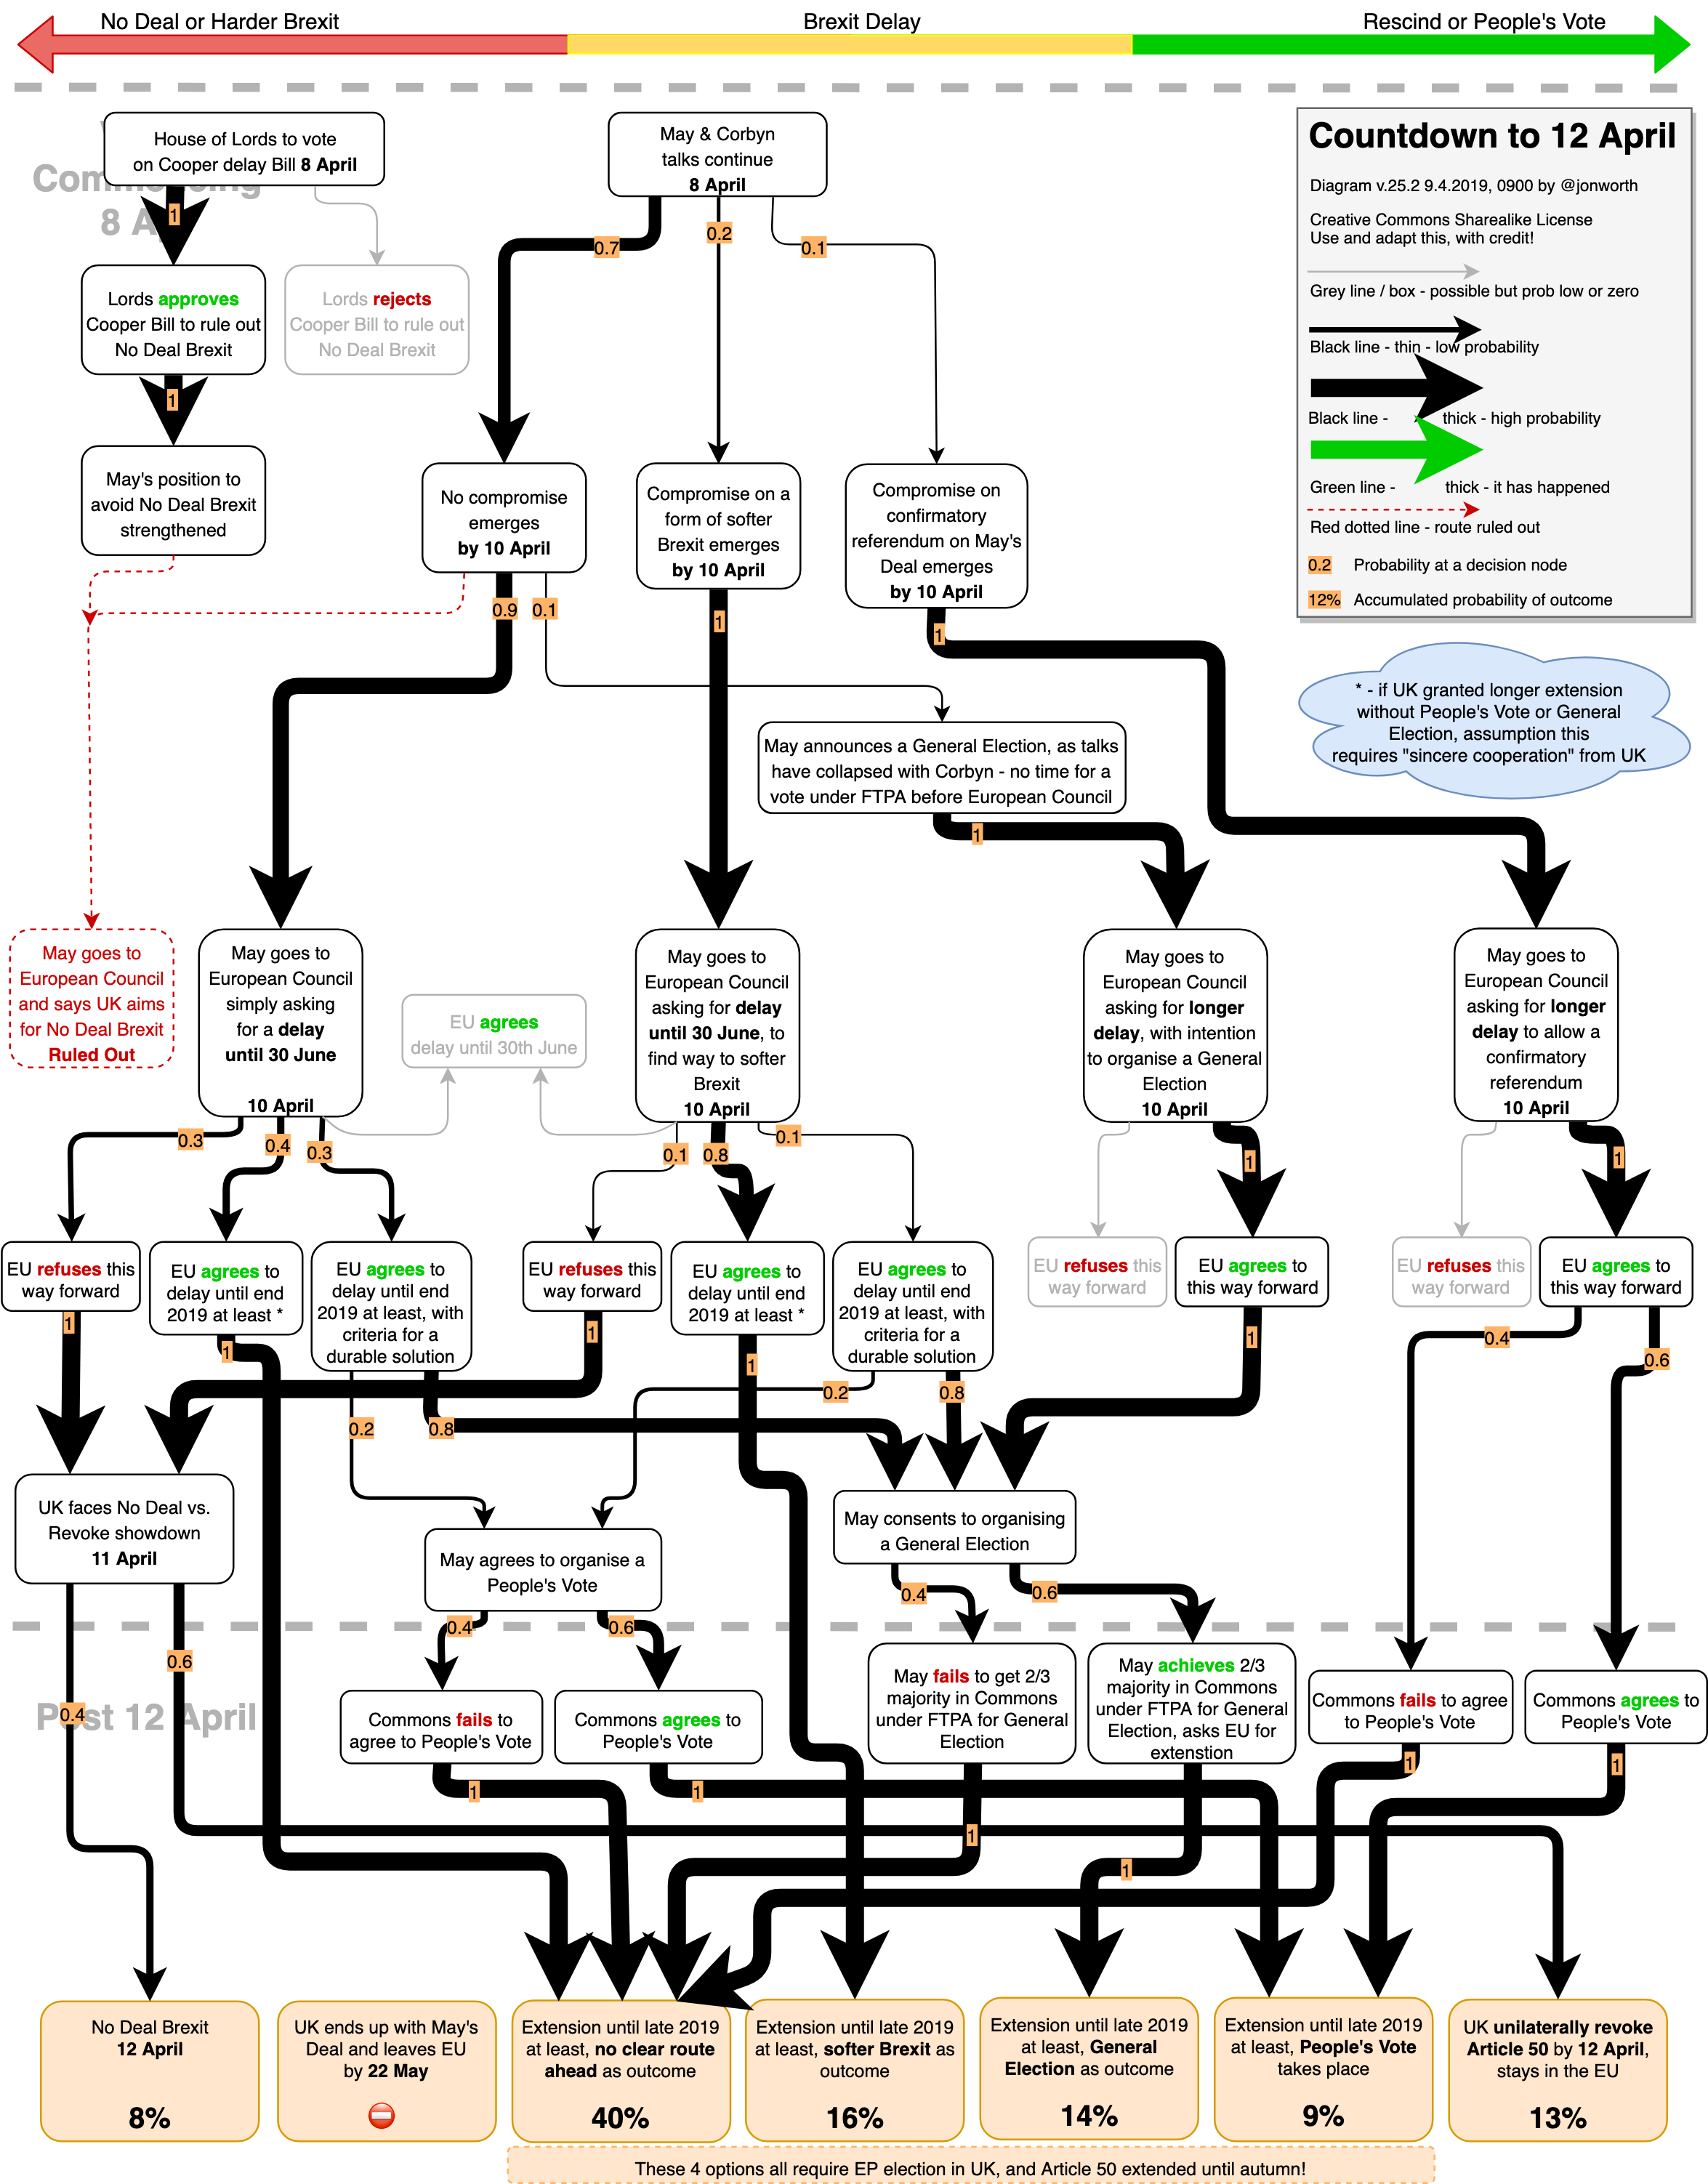
Version 26 – 11.4.2019, 1400
6 month Article 50 extension agreed – what next?

Version 25.2 – 9.4.2019, 0900
Slightly amended, prior to the European Council 10 April and Brexit 12 April?
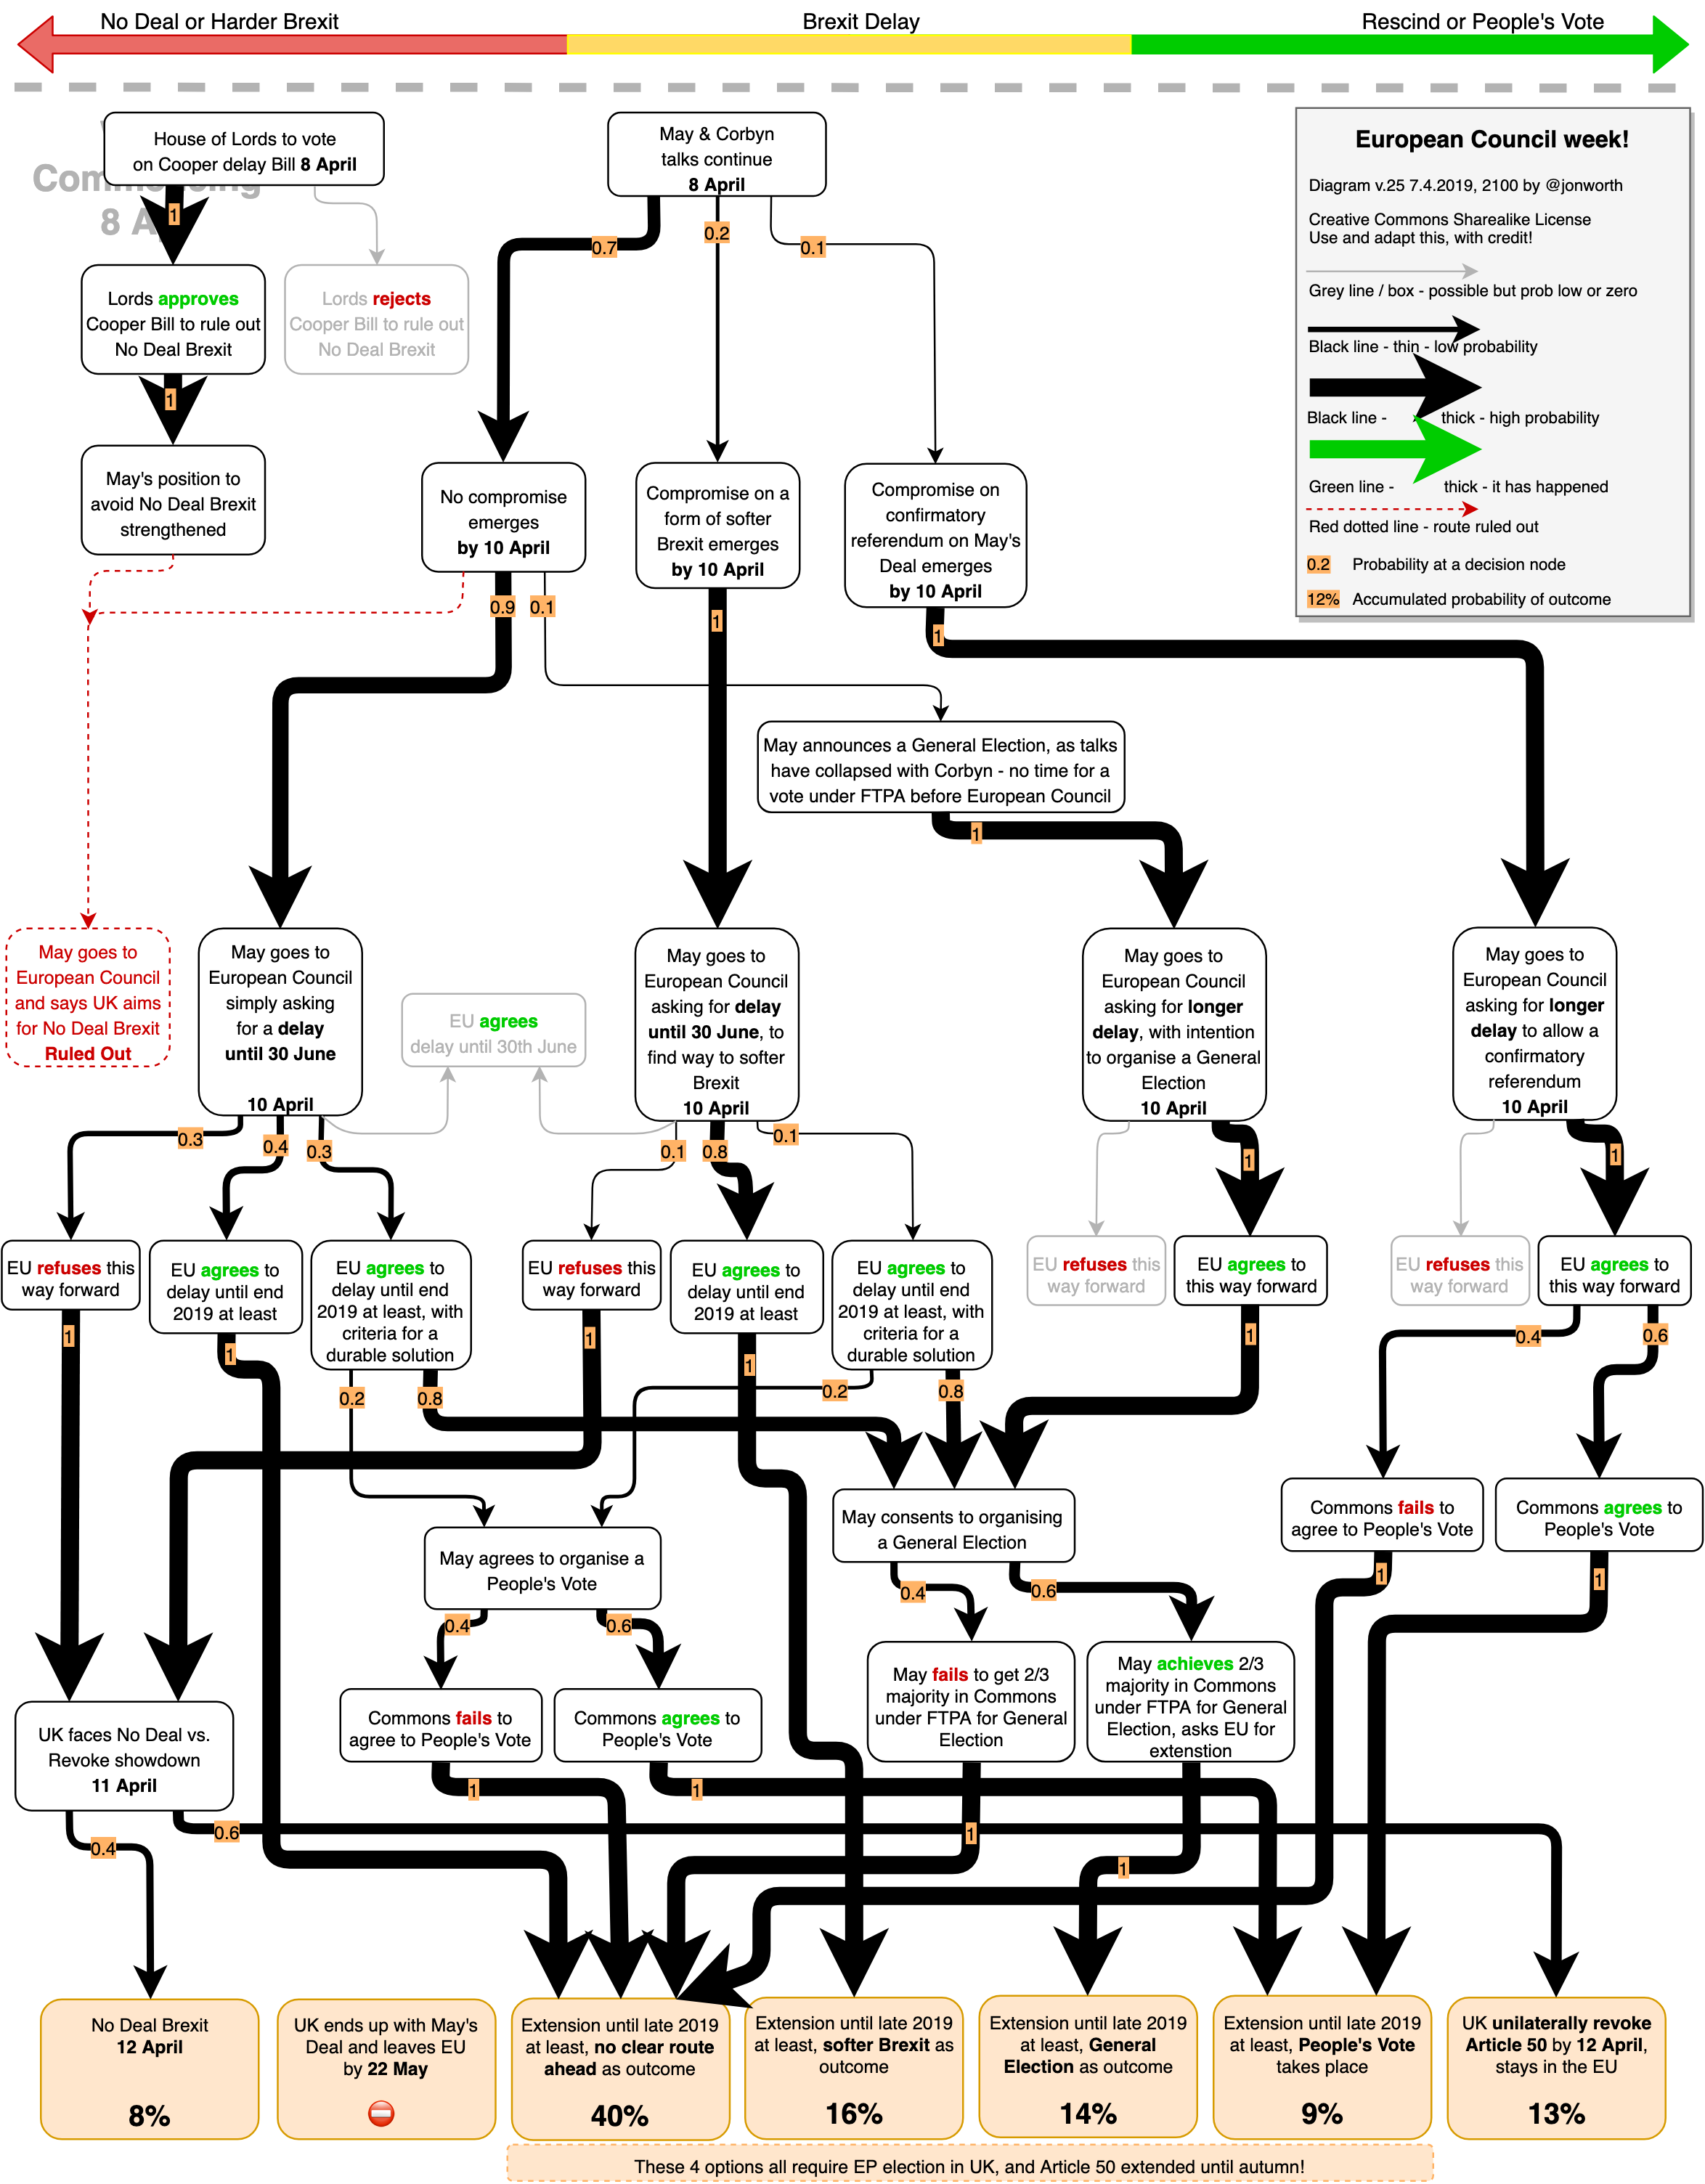
Version 25 – 7.4.2019, 2100
Prior to the European Council 10 April and Brexit 12 April?
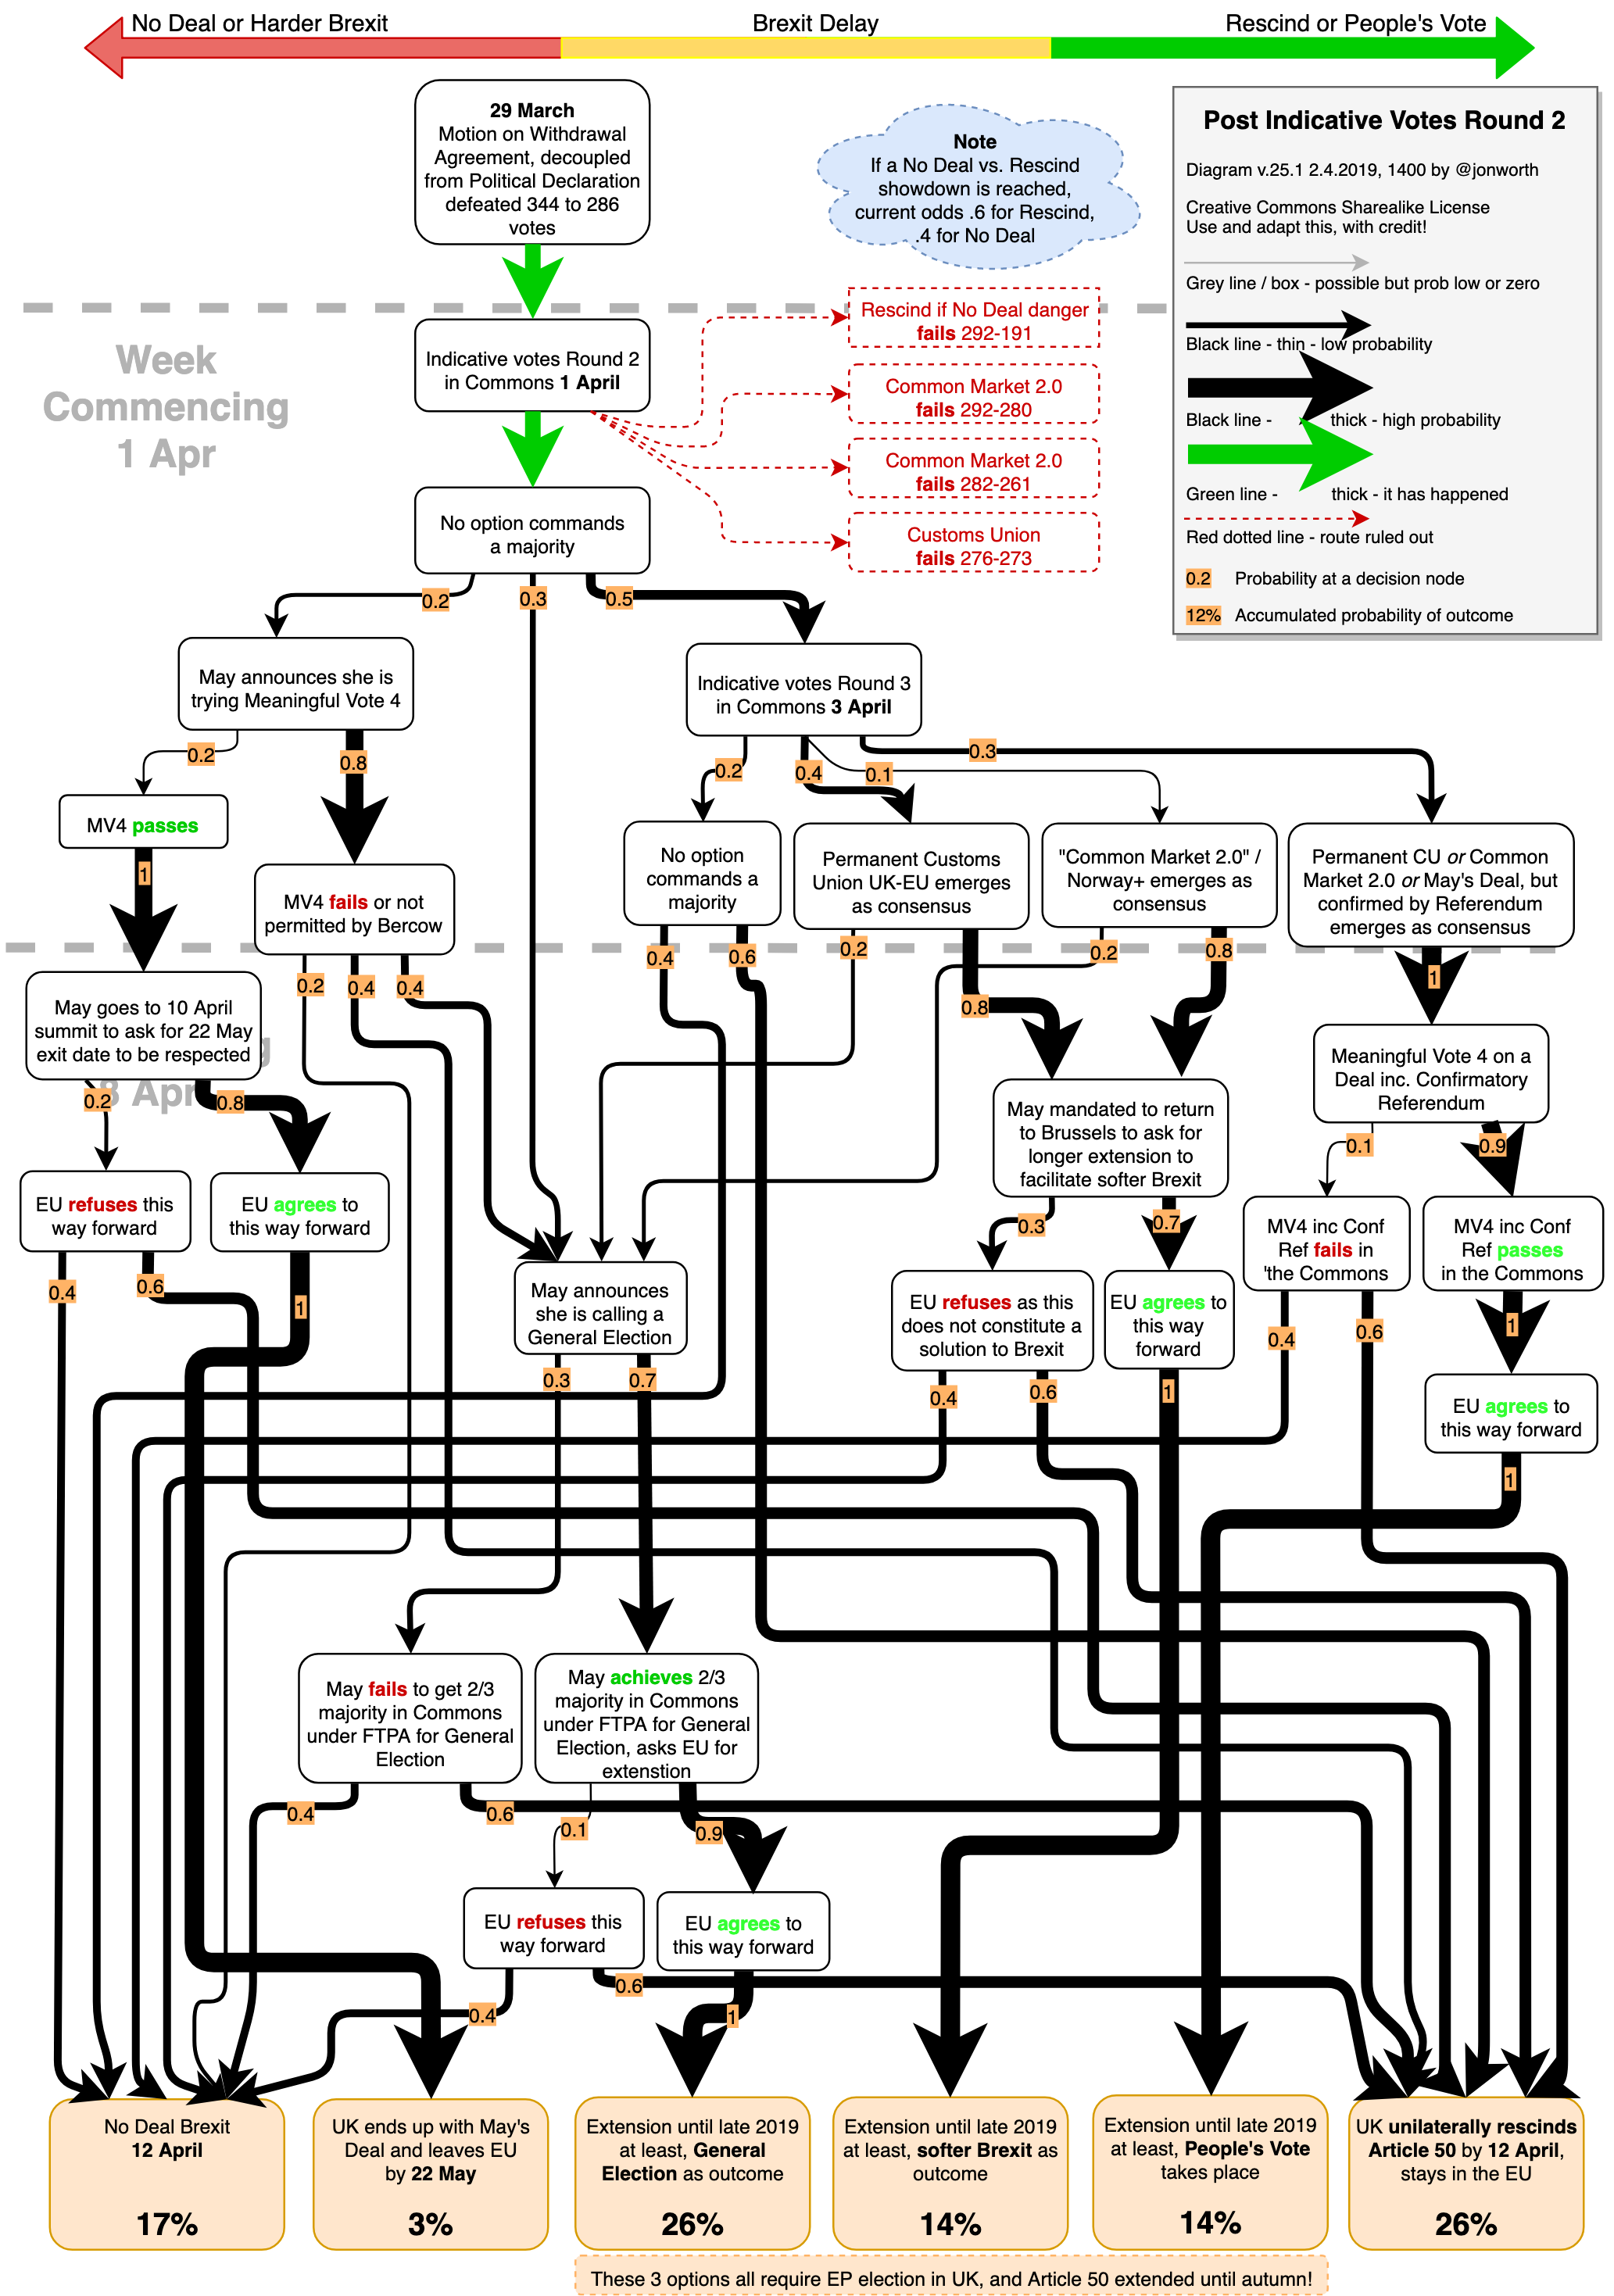
Version 24.1 – 2.4.2019, 1400
Post Indicative Votes Round 2, slightly revised.
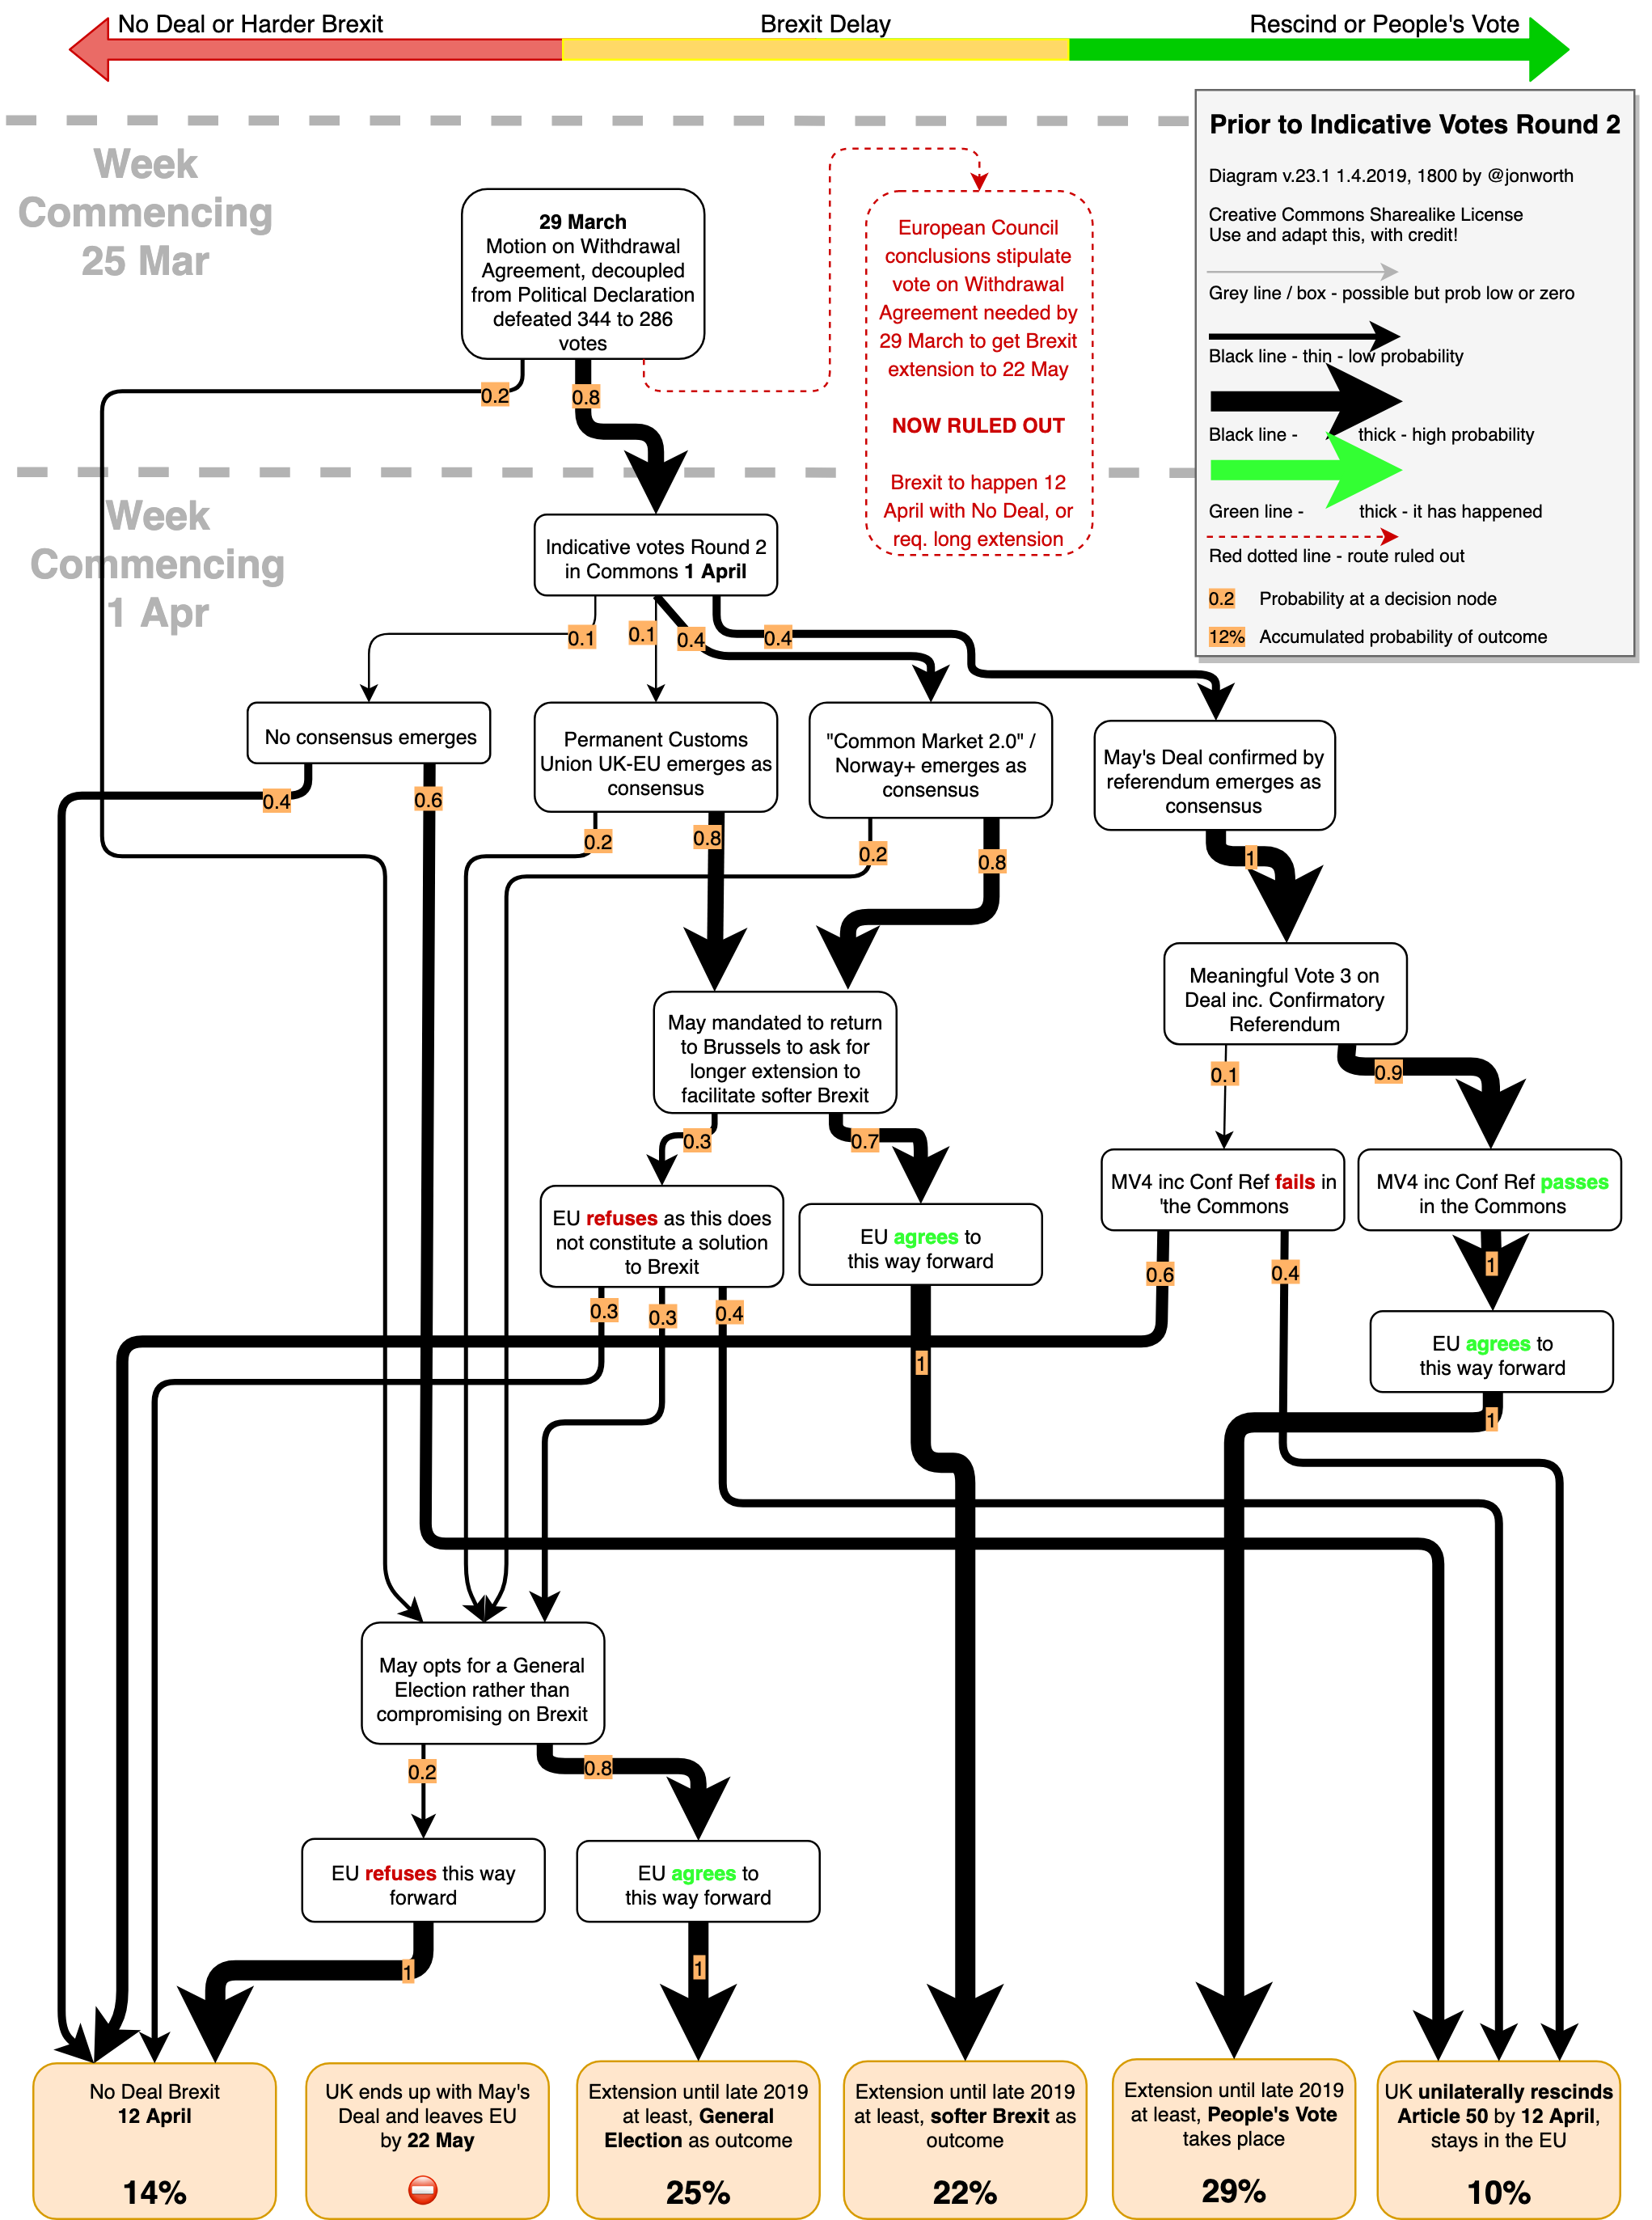
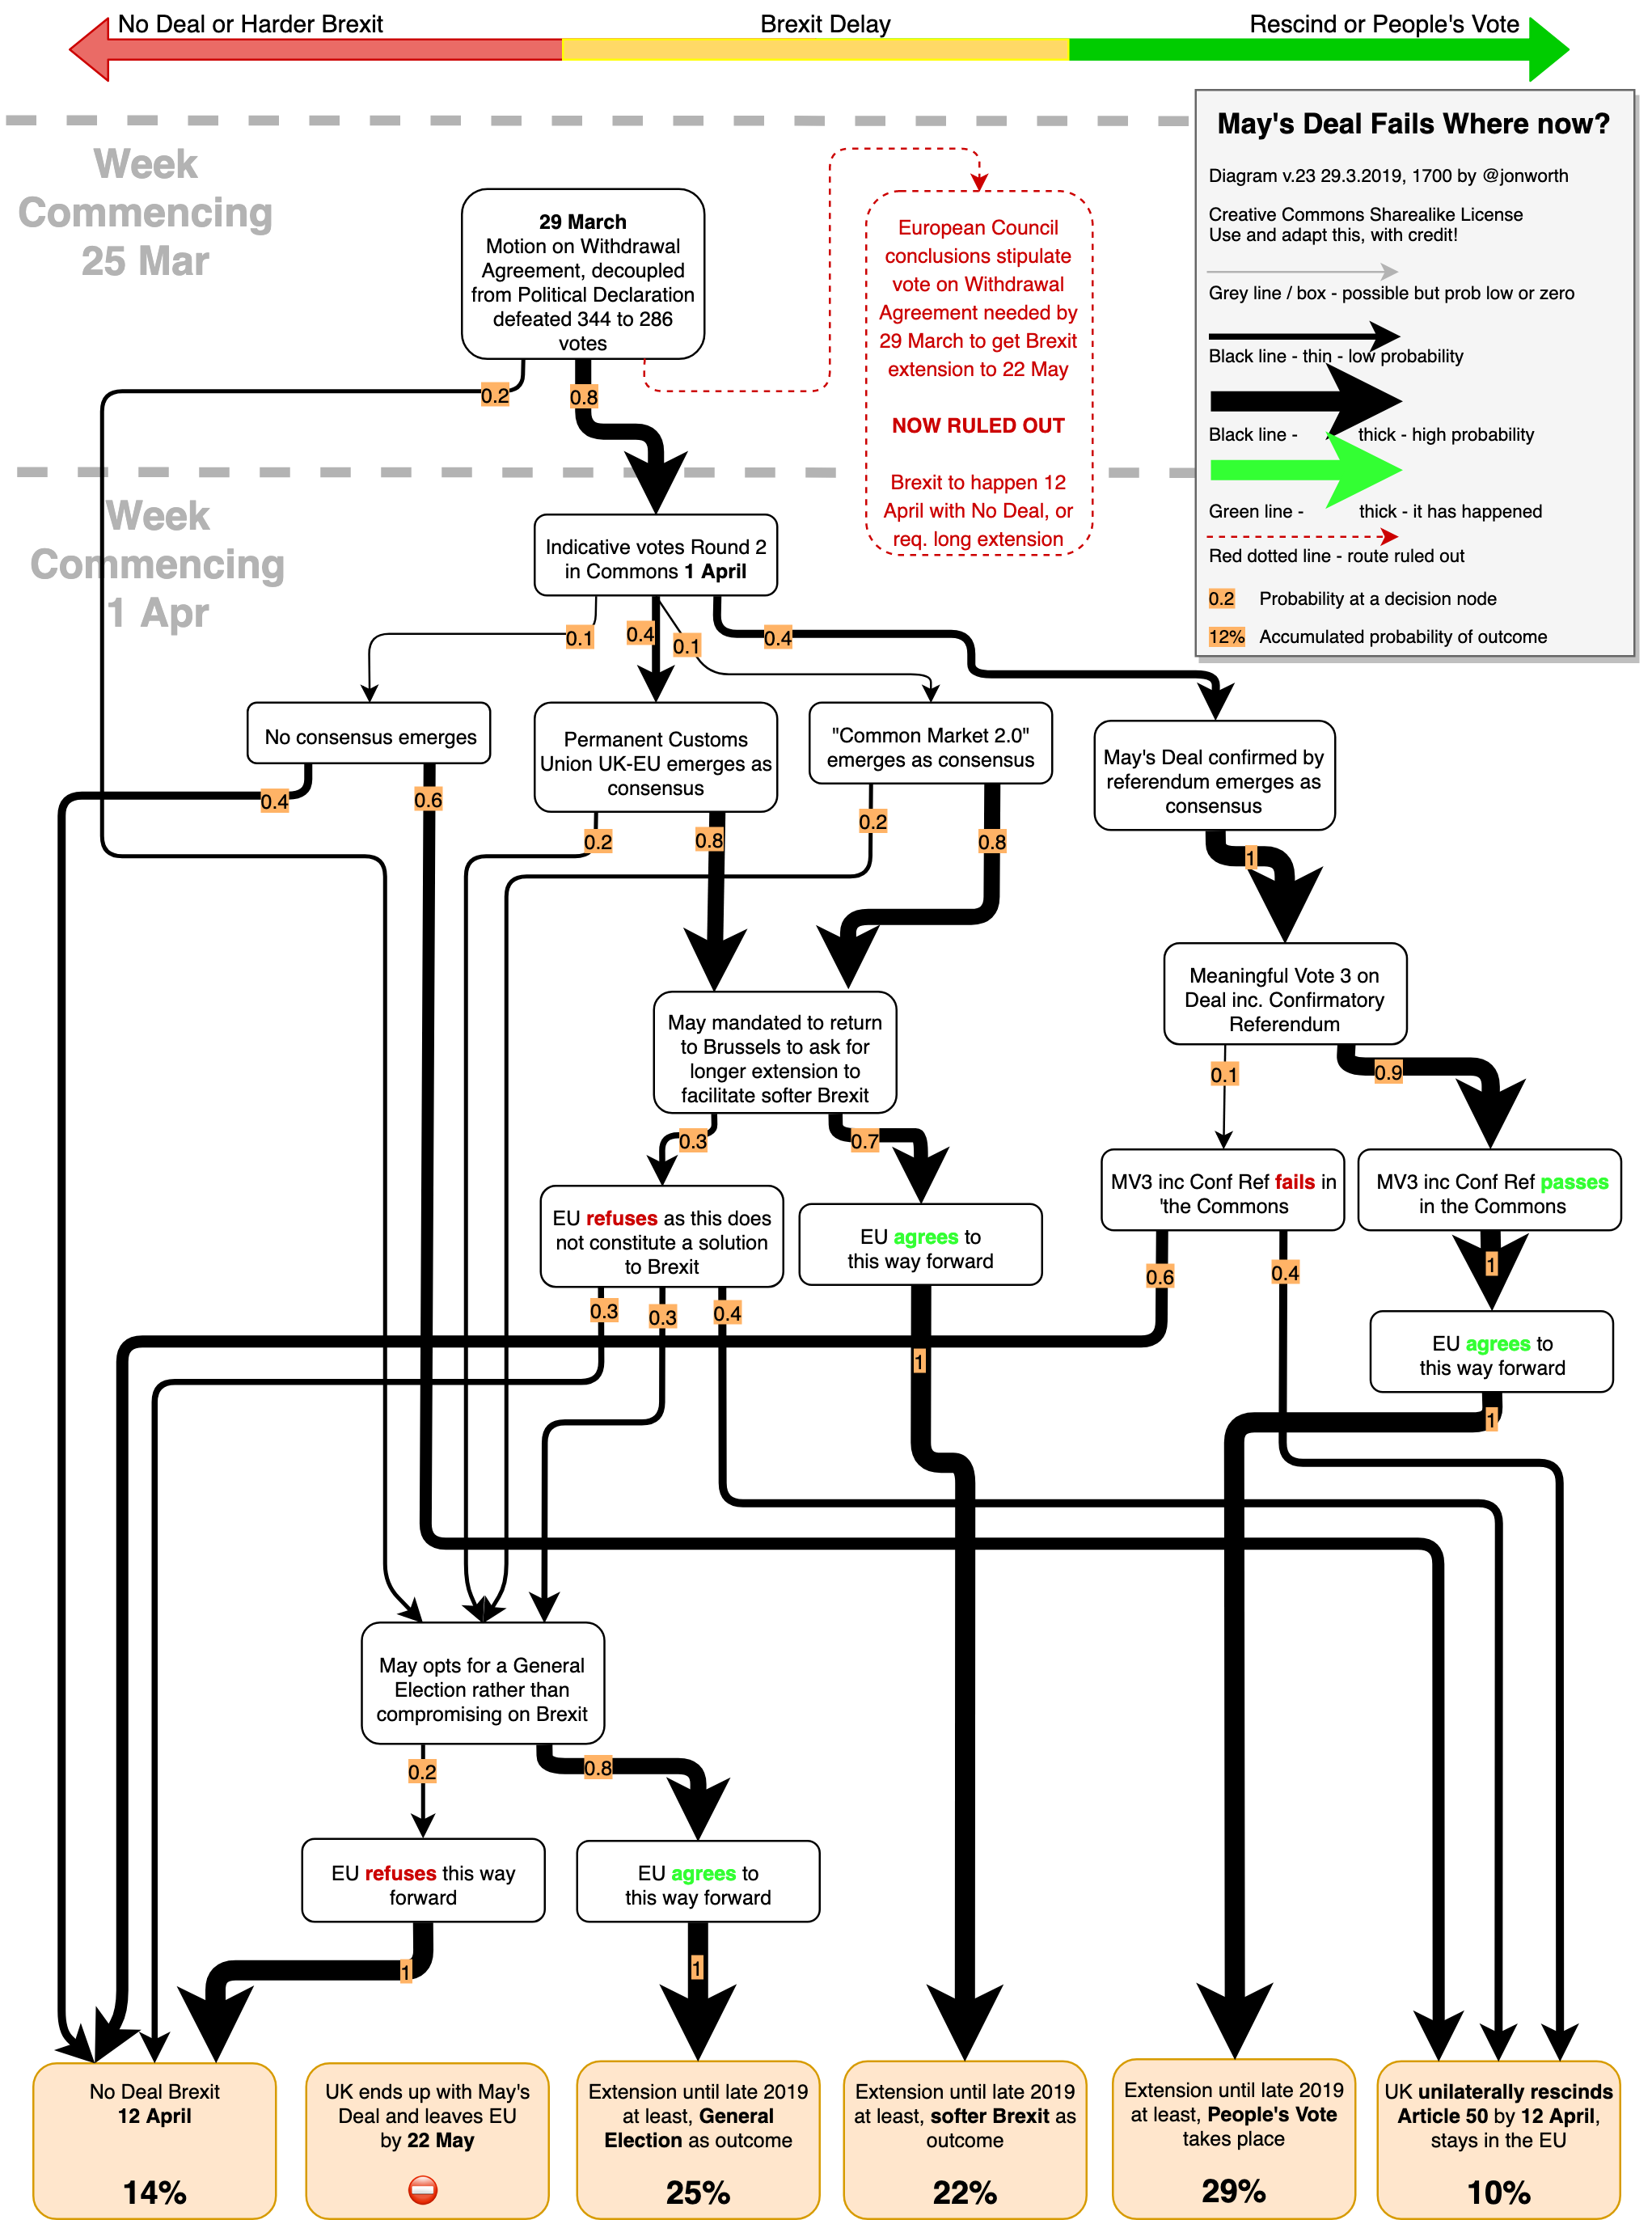
Version 23.1 – 1.4.2019, 1800
Prior to Indicative Votes Round 2.
Version 23 – 29.3.2019, 1630
May’s 3rd vote to get the deal through fails.
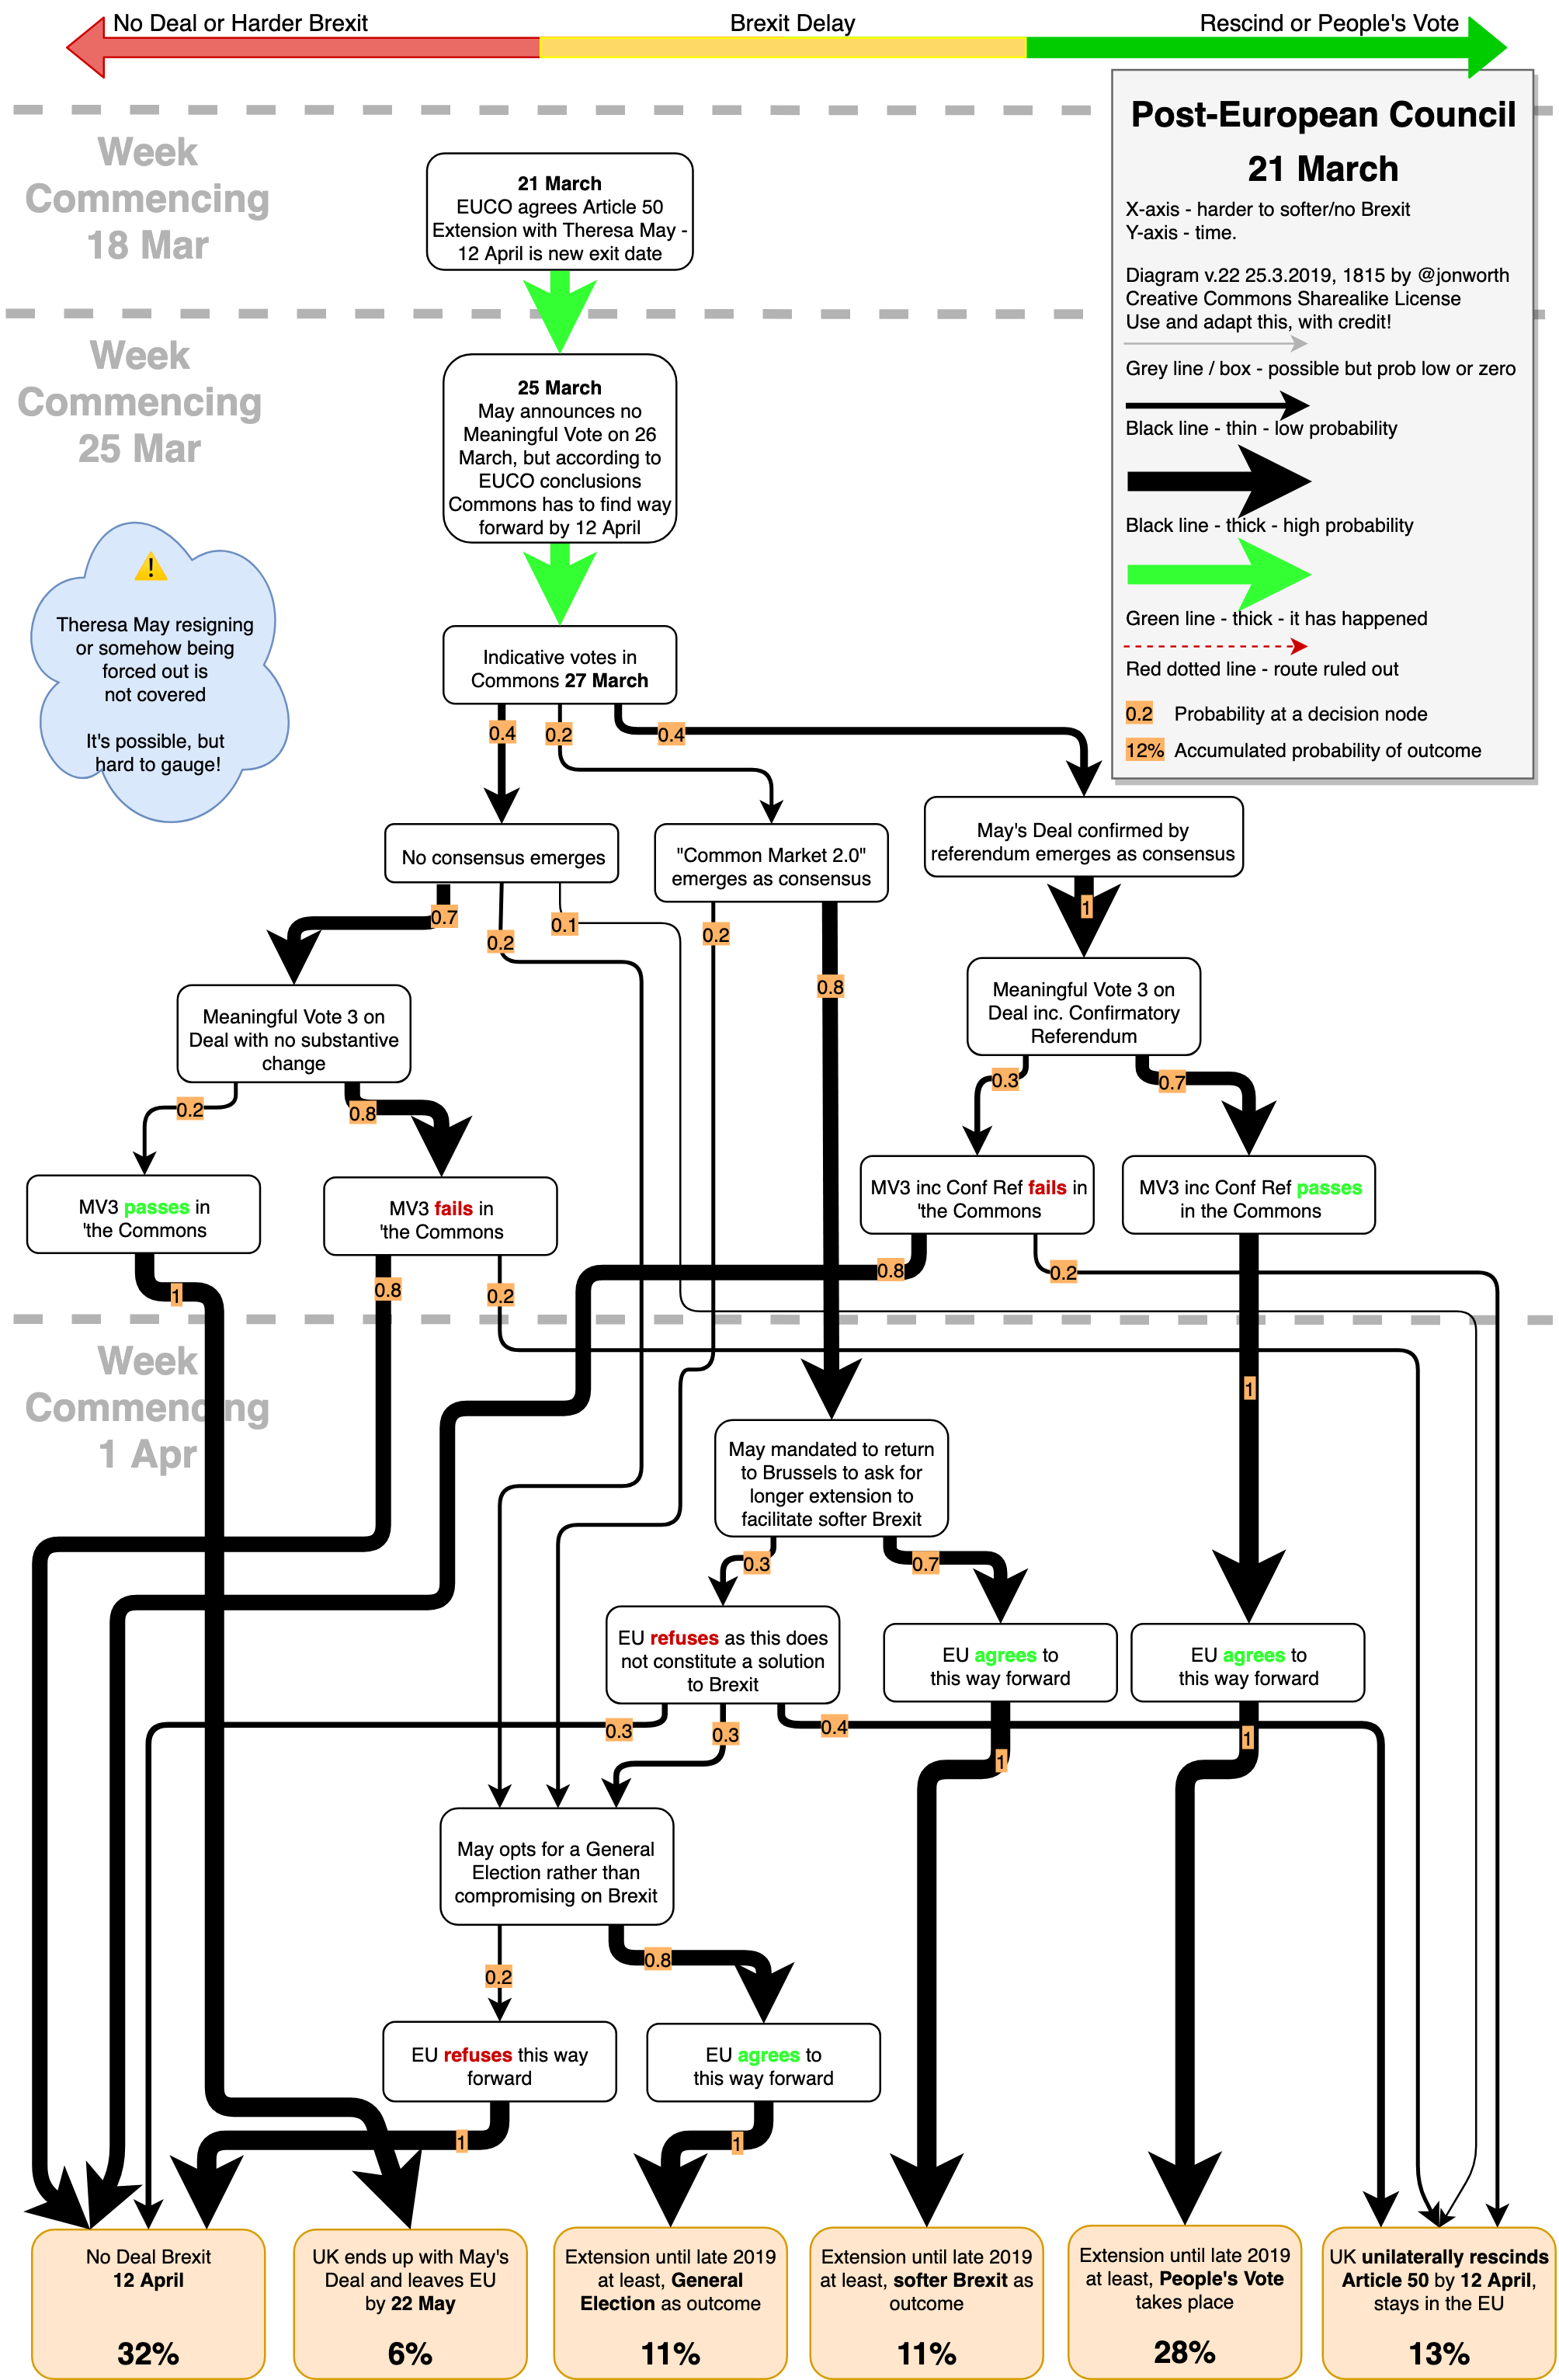
Version 22 – 25.3.2019, 1815
May not holding a Meaningful Vote on 26 March, and then chances of indicative vote outcomes.
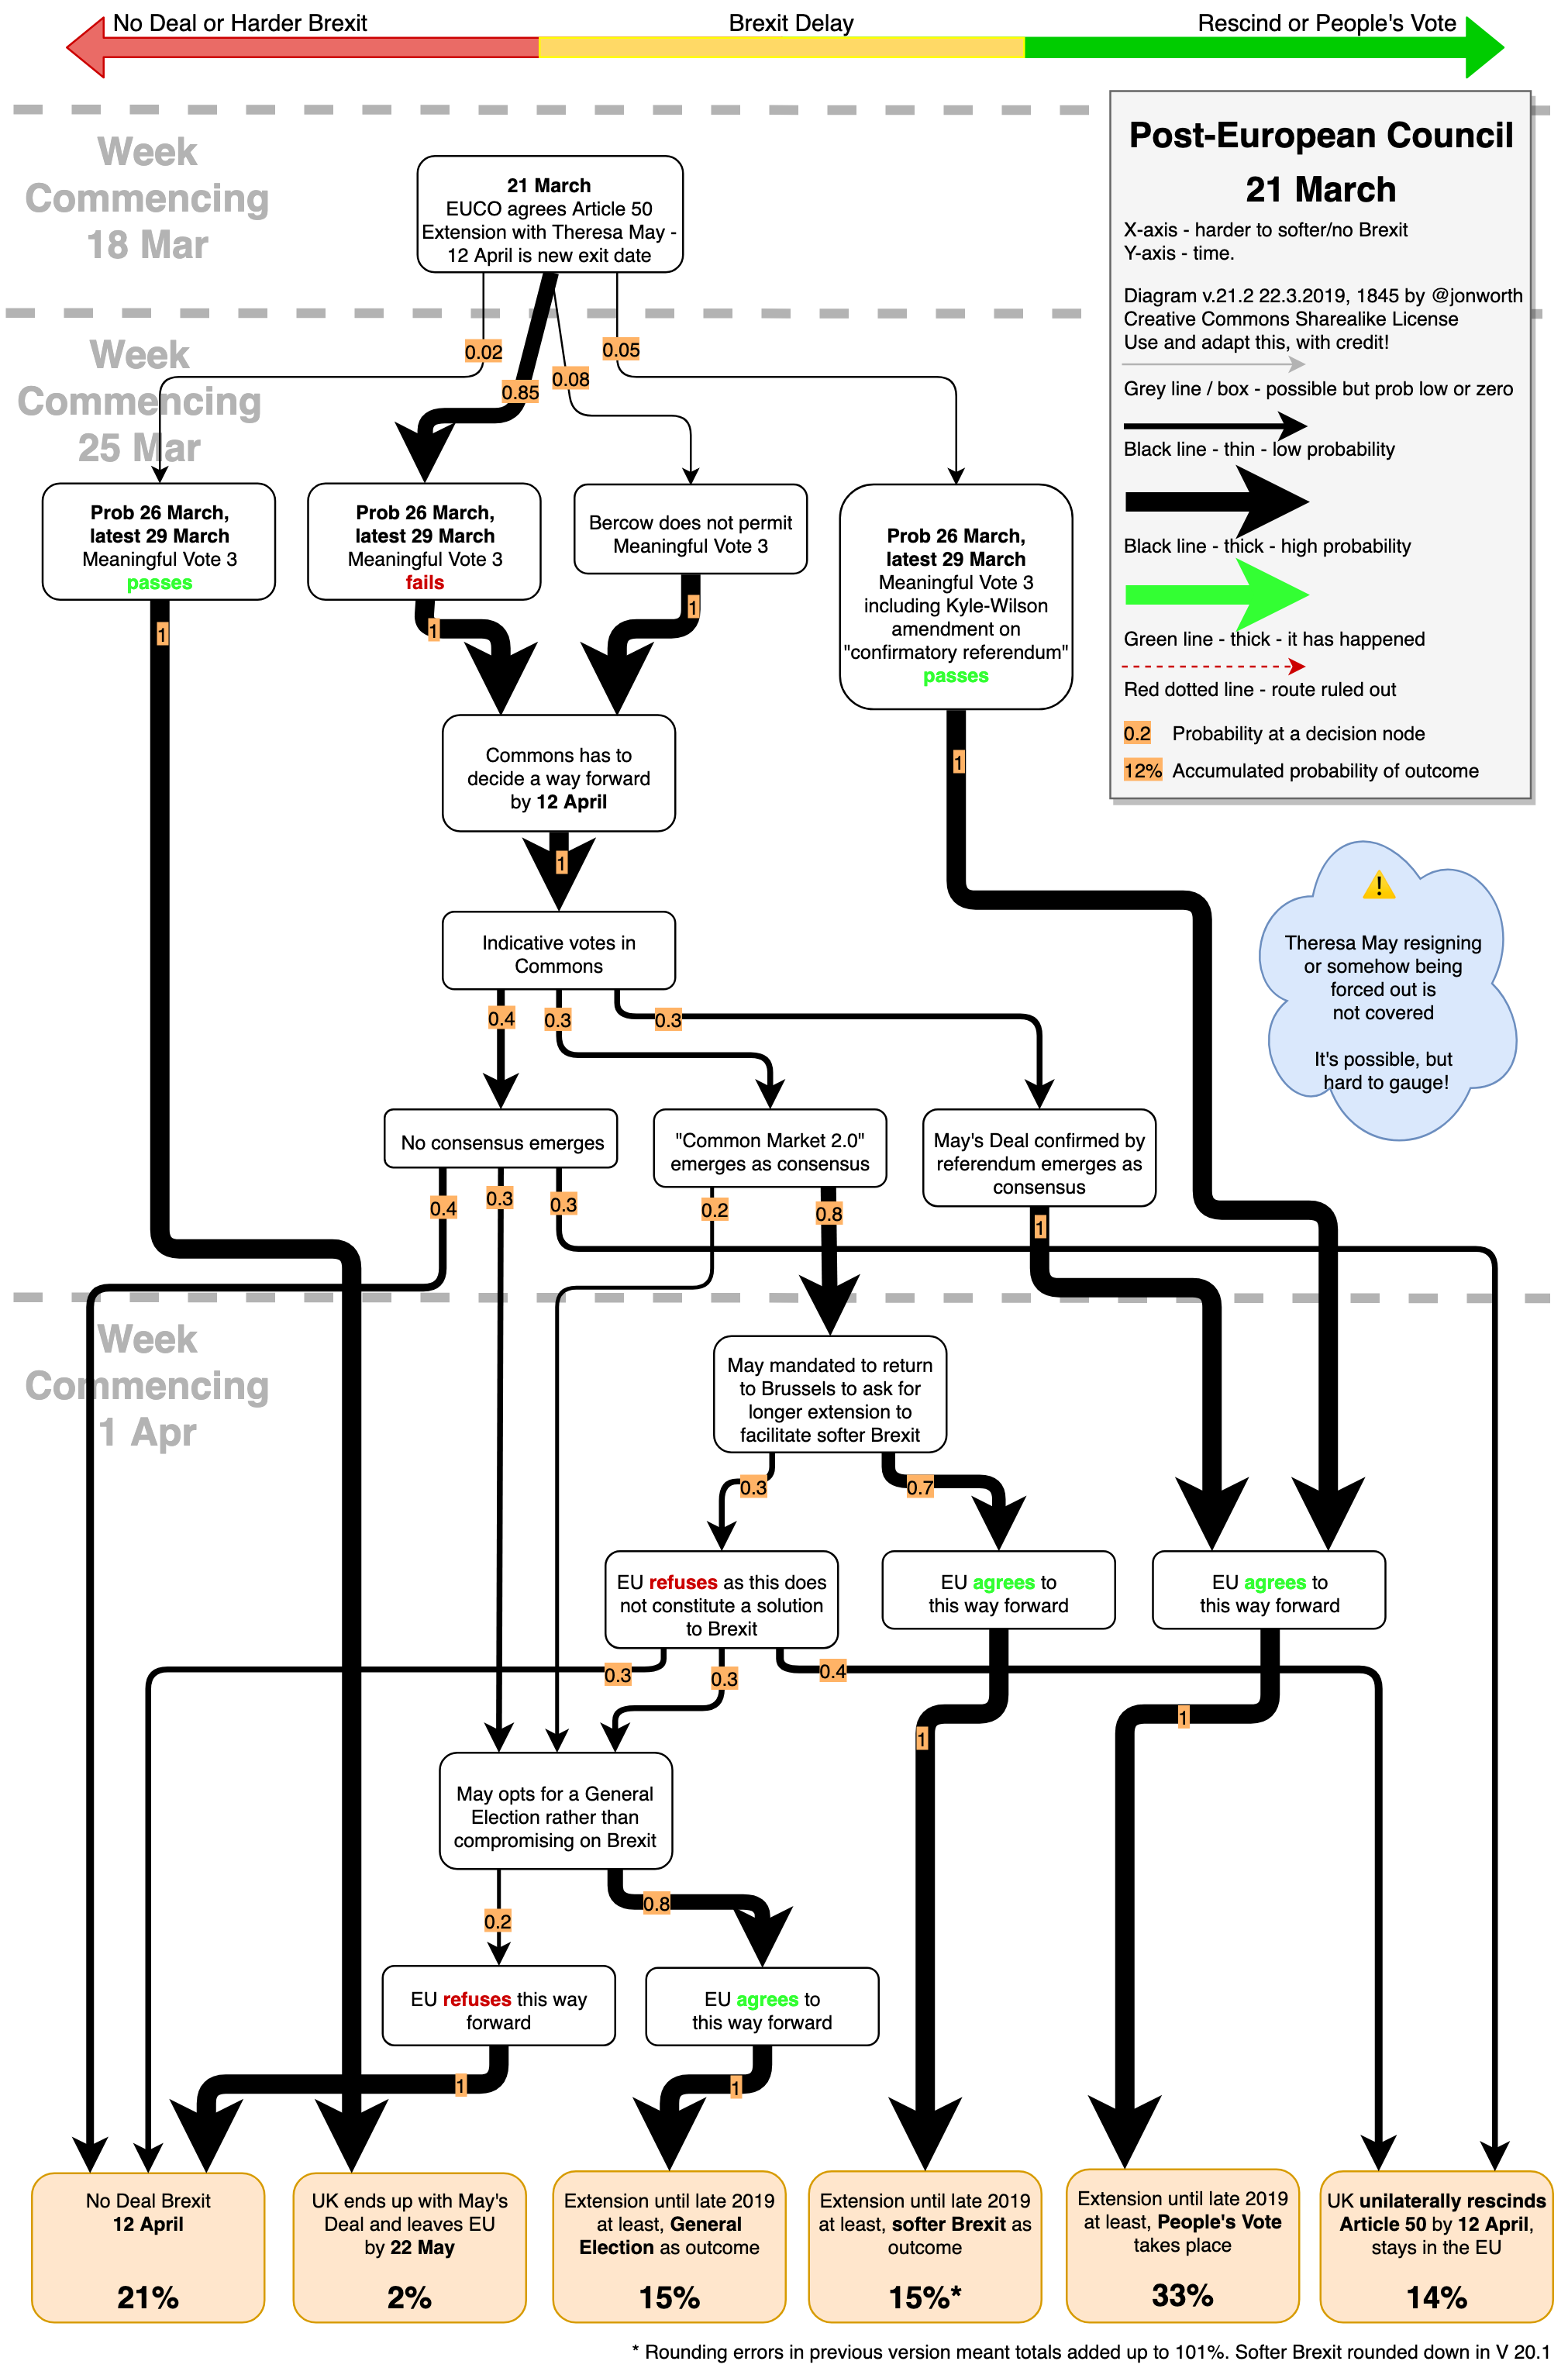
Version 21.2 – 25.3.2019, 1545
In light of the Extension system agreed at EUCO late on 21 March, and subsequent comments on Meaningful Votes and indicative votes
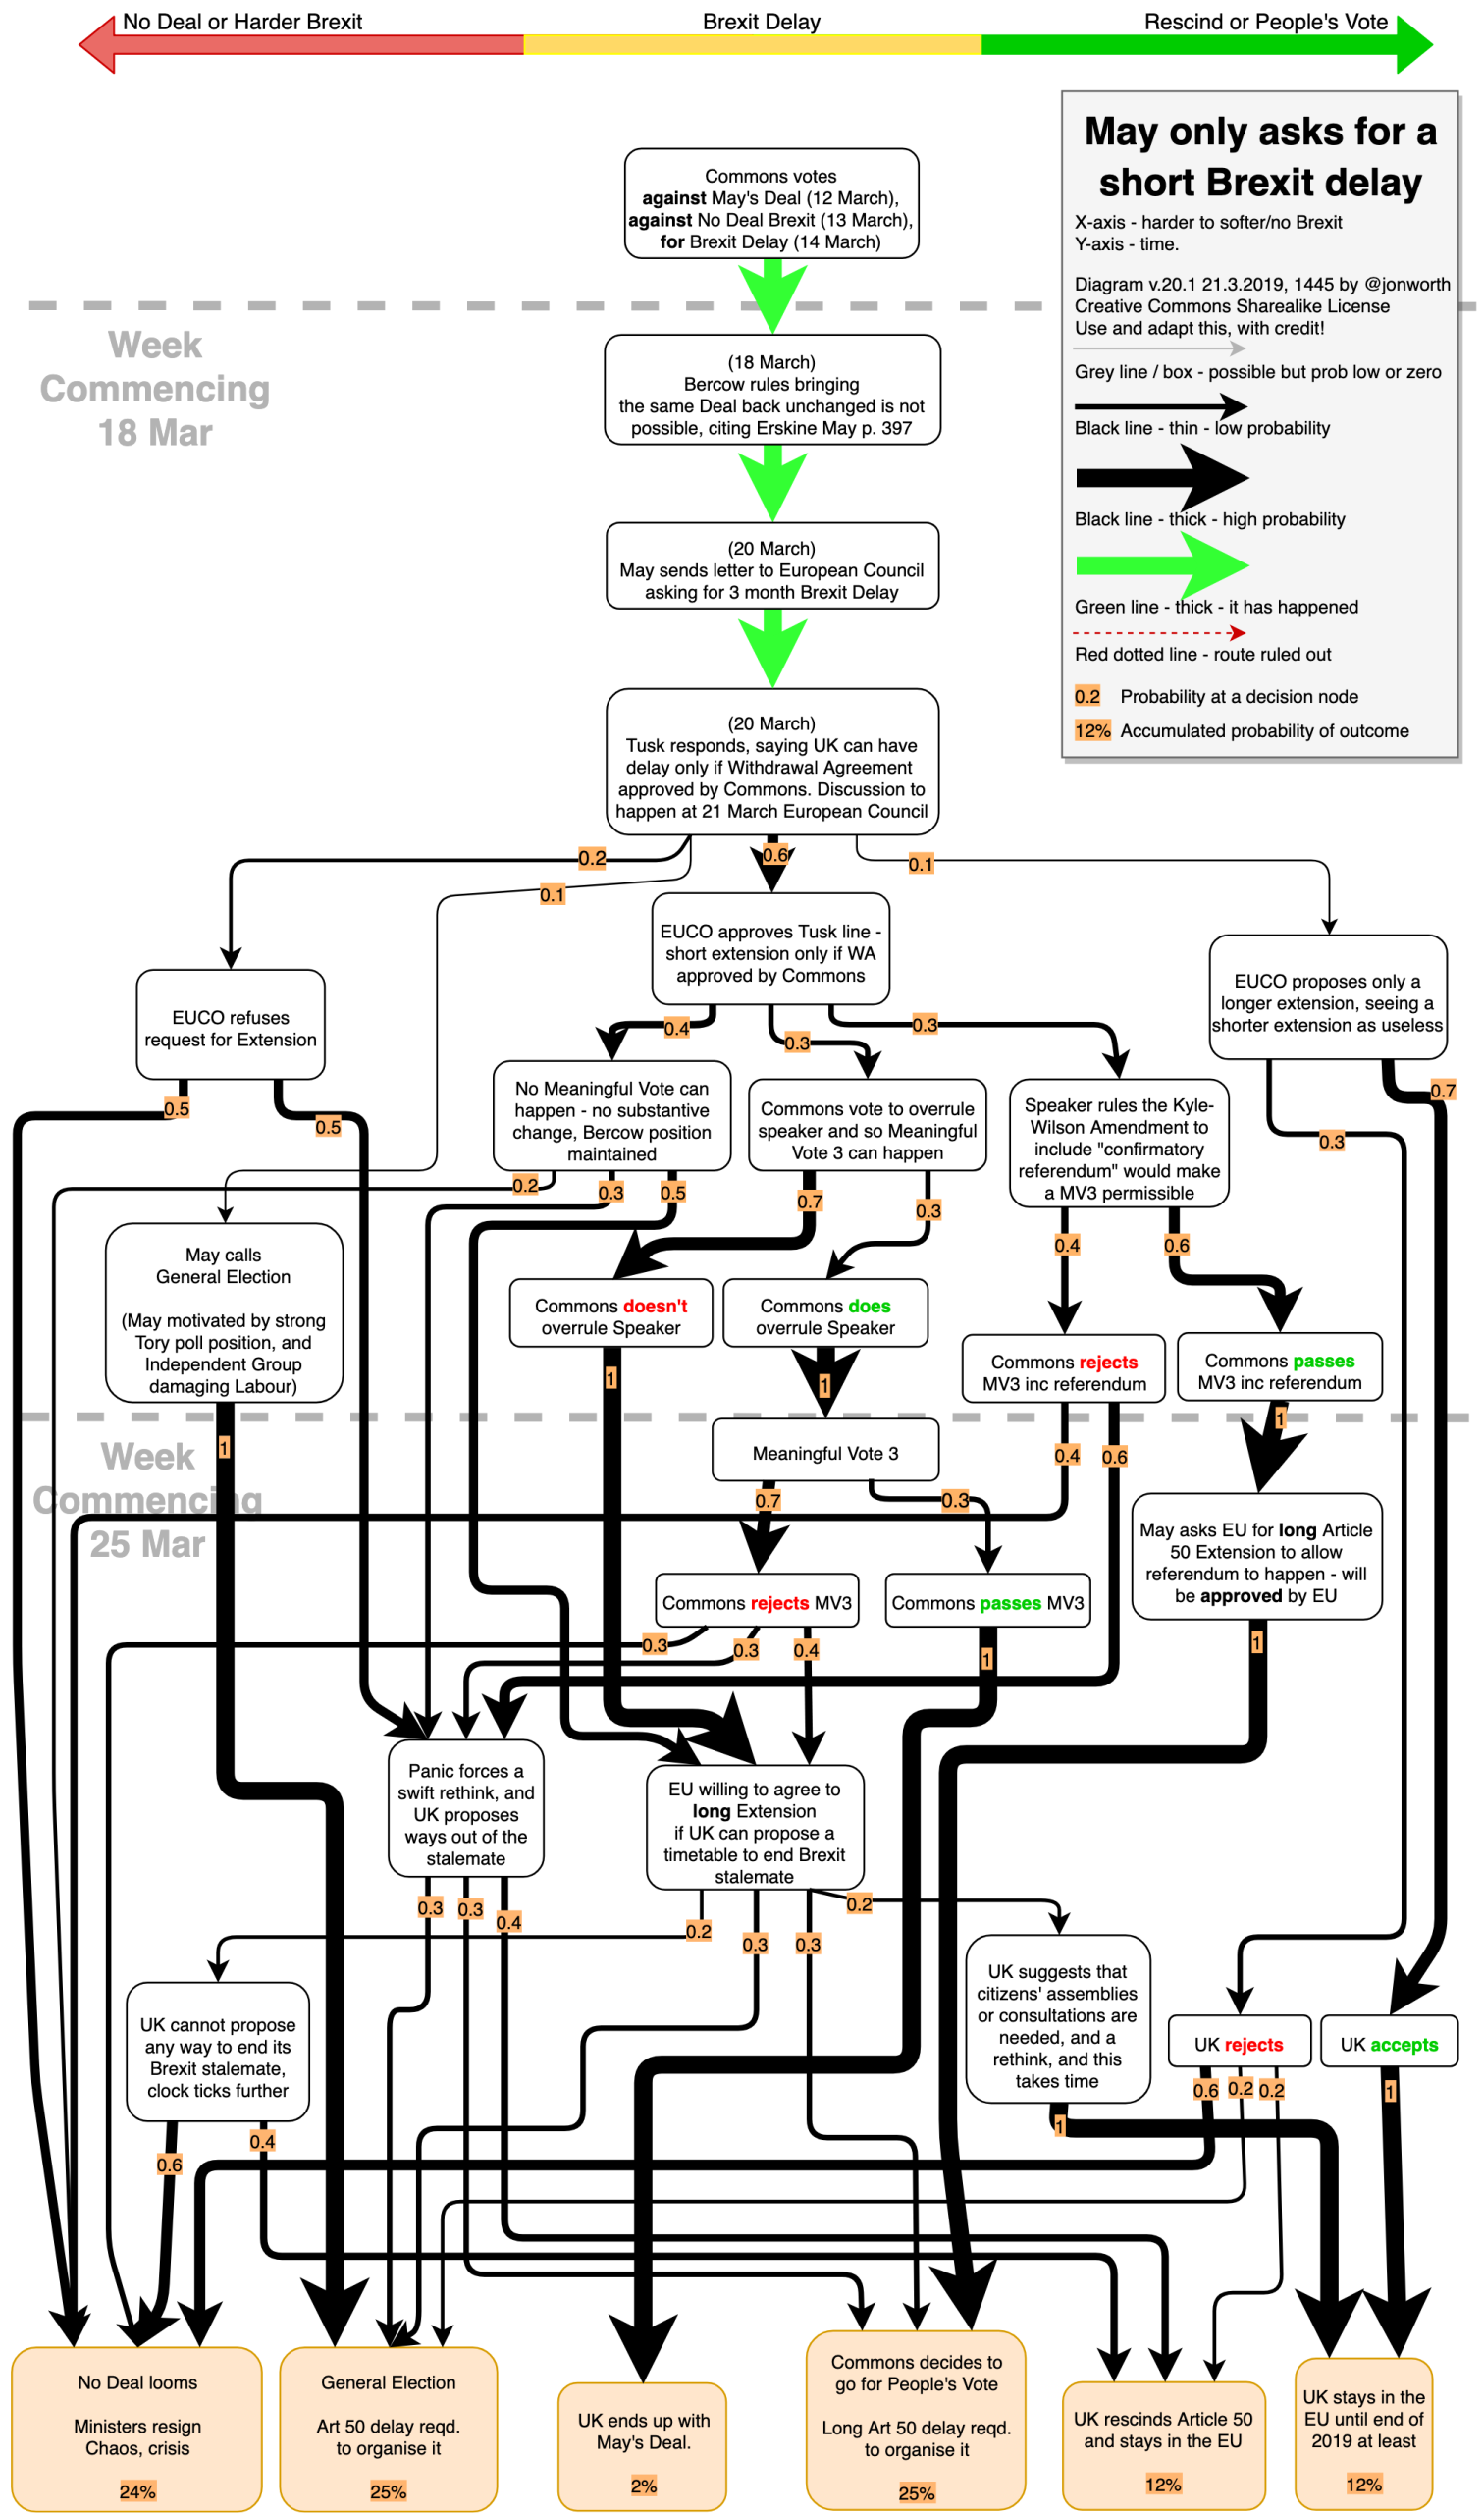
Version 20.1 – 21.3.2019, 1445
Adjustments and detail a week ahead of Brexit
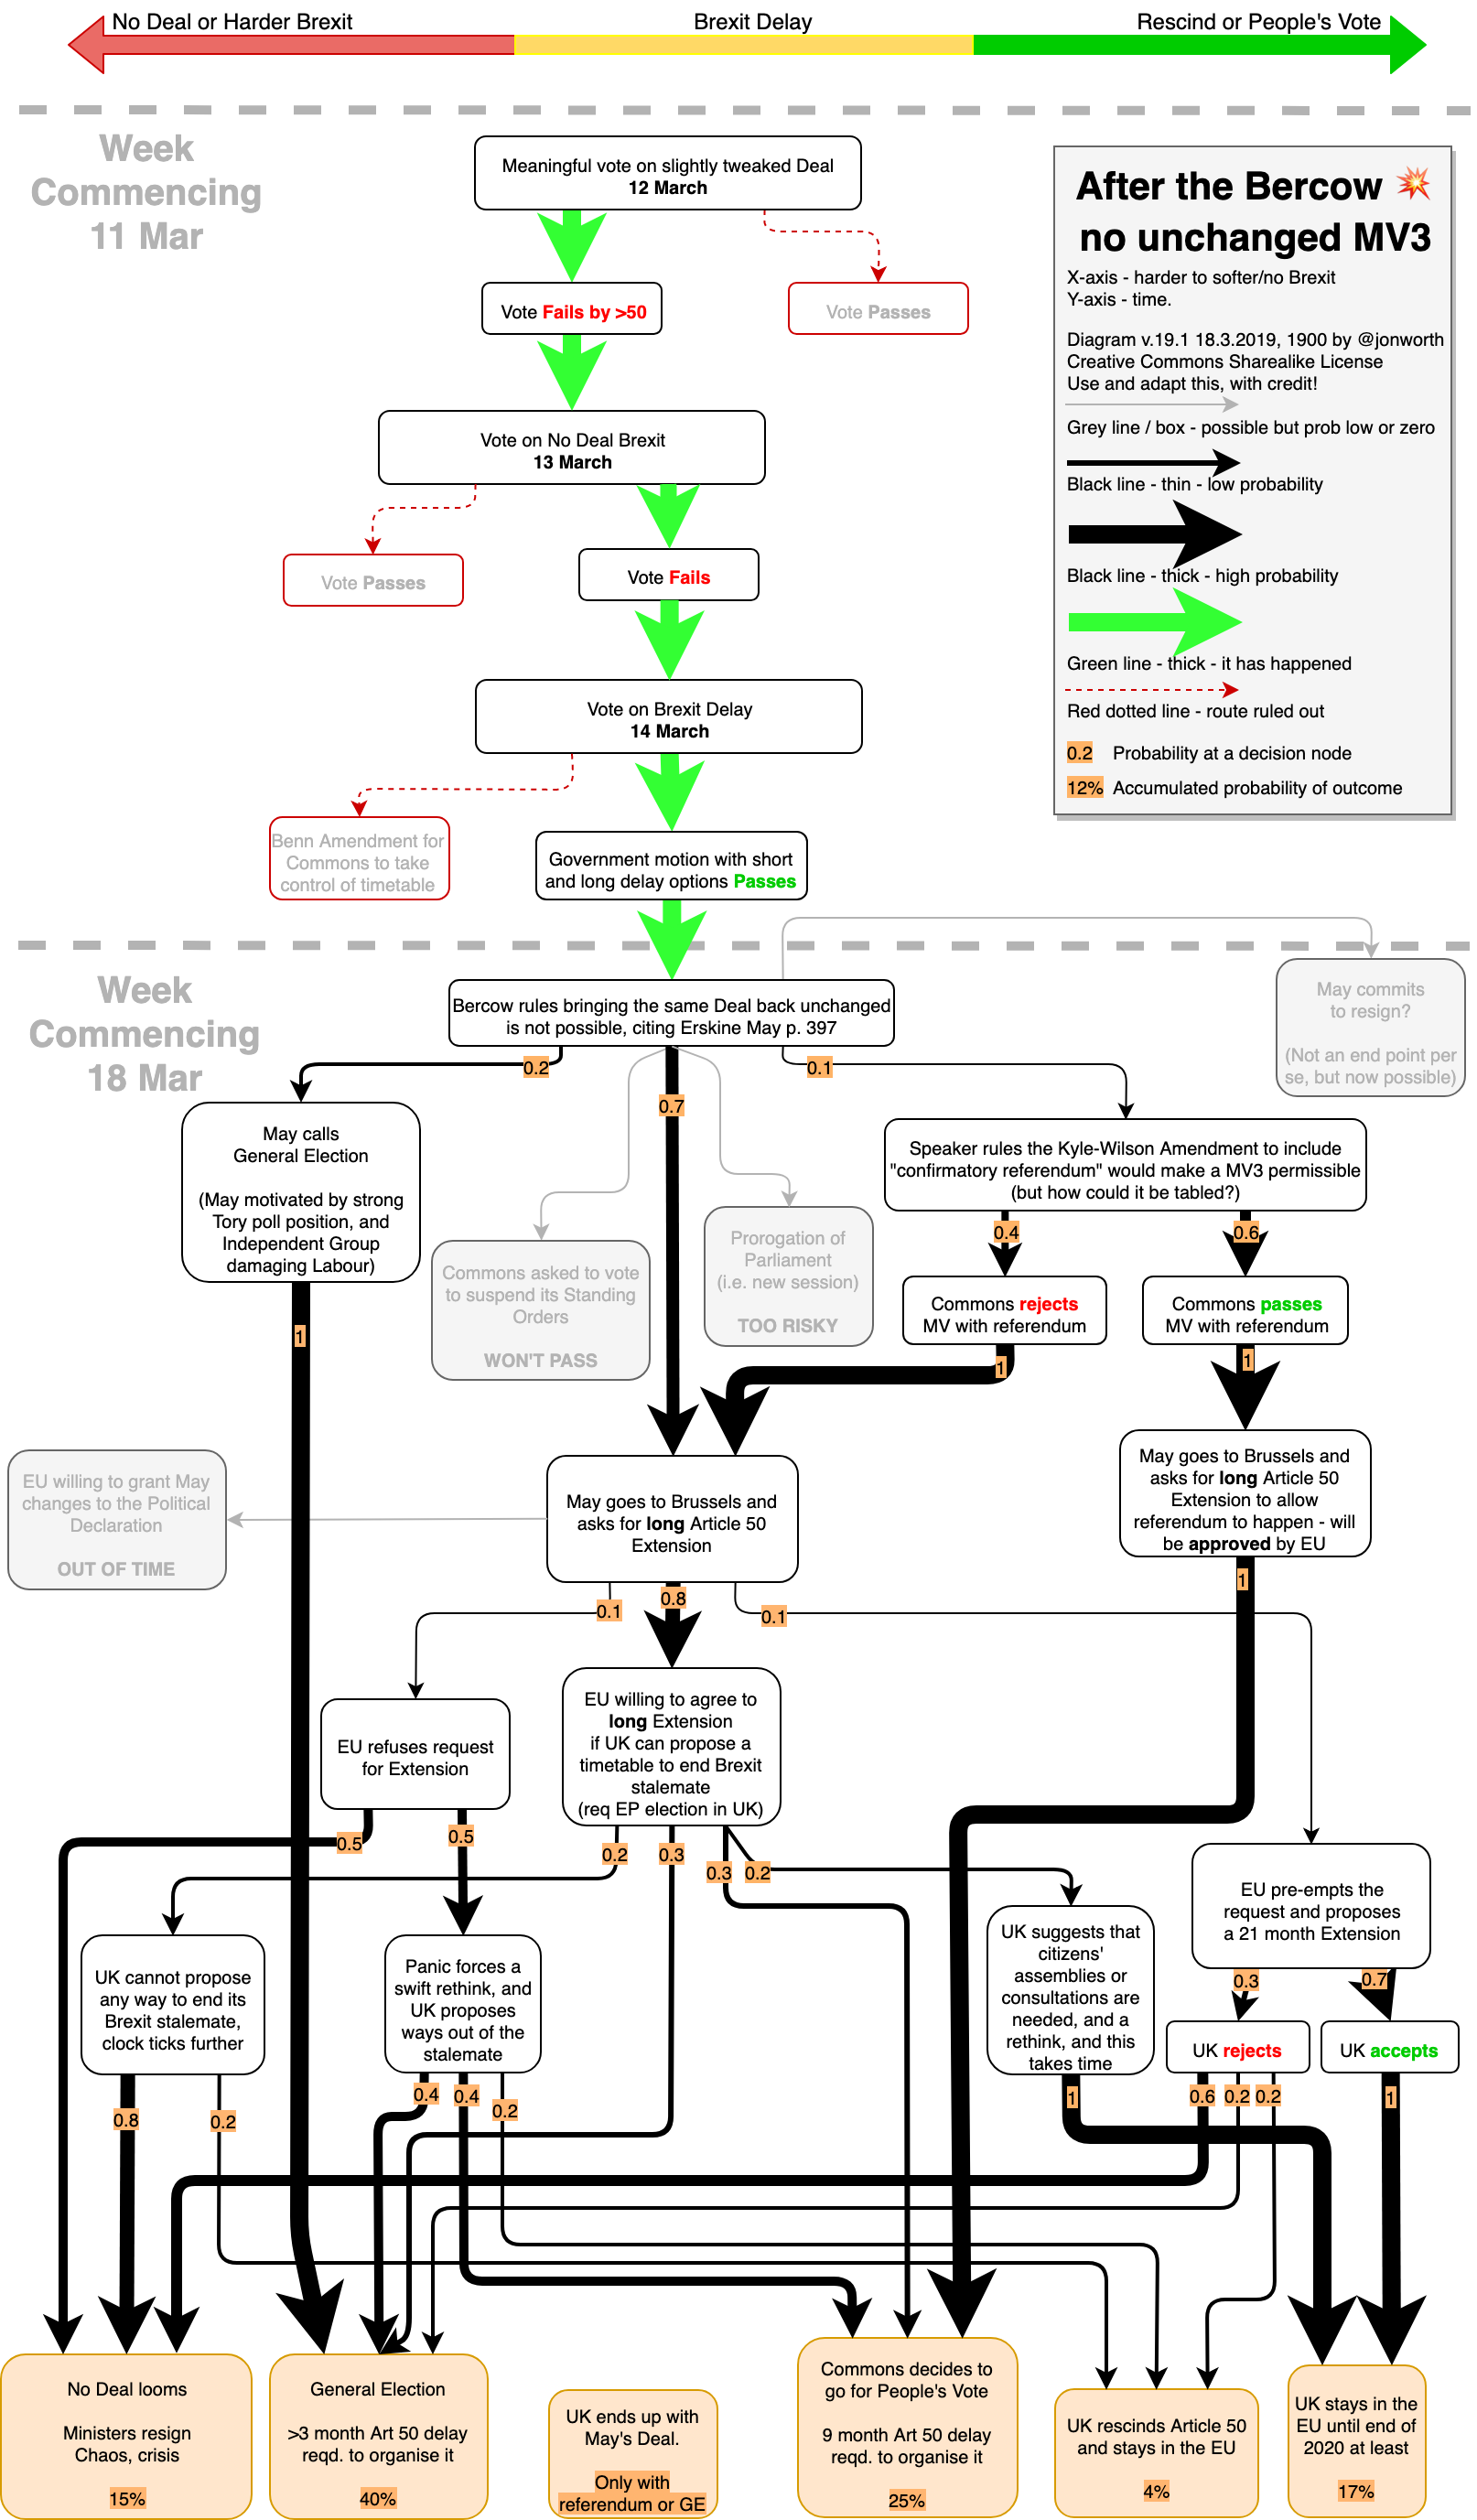
Version 19.1 – 15.3.2019, 1900
Adjustments and detail after version 19
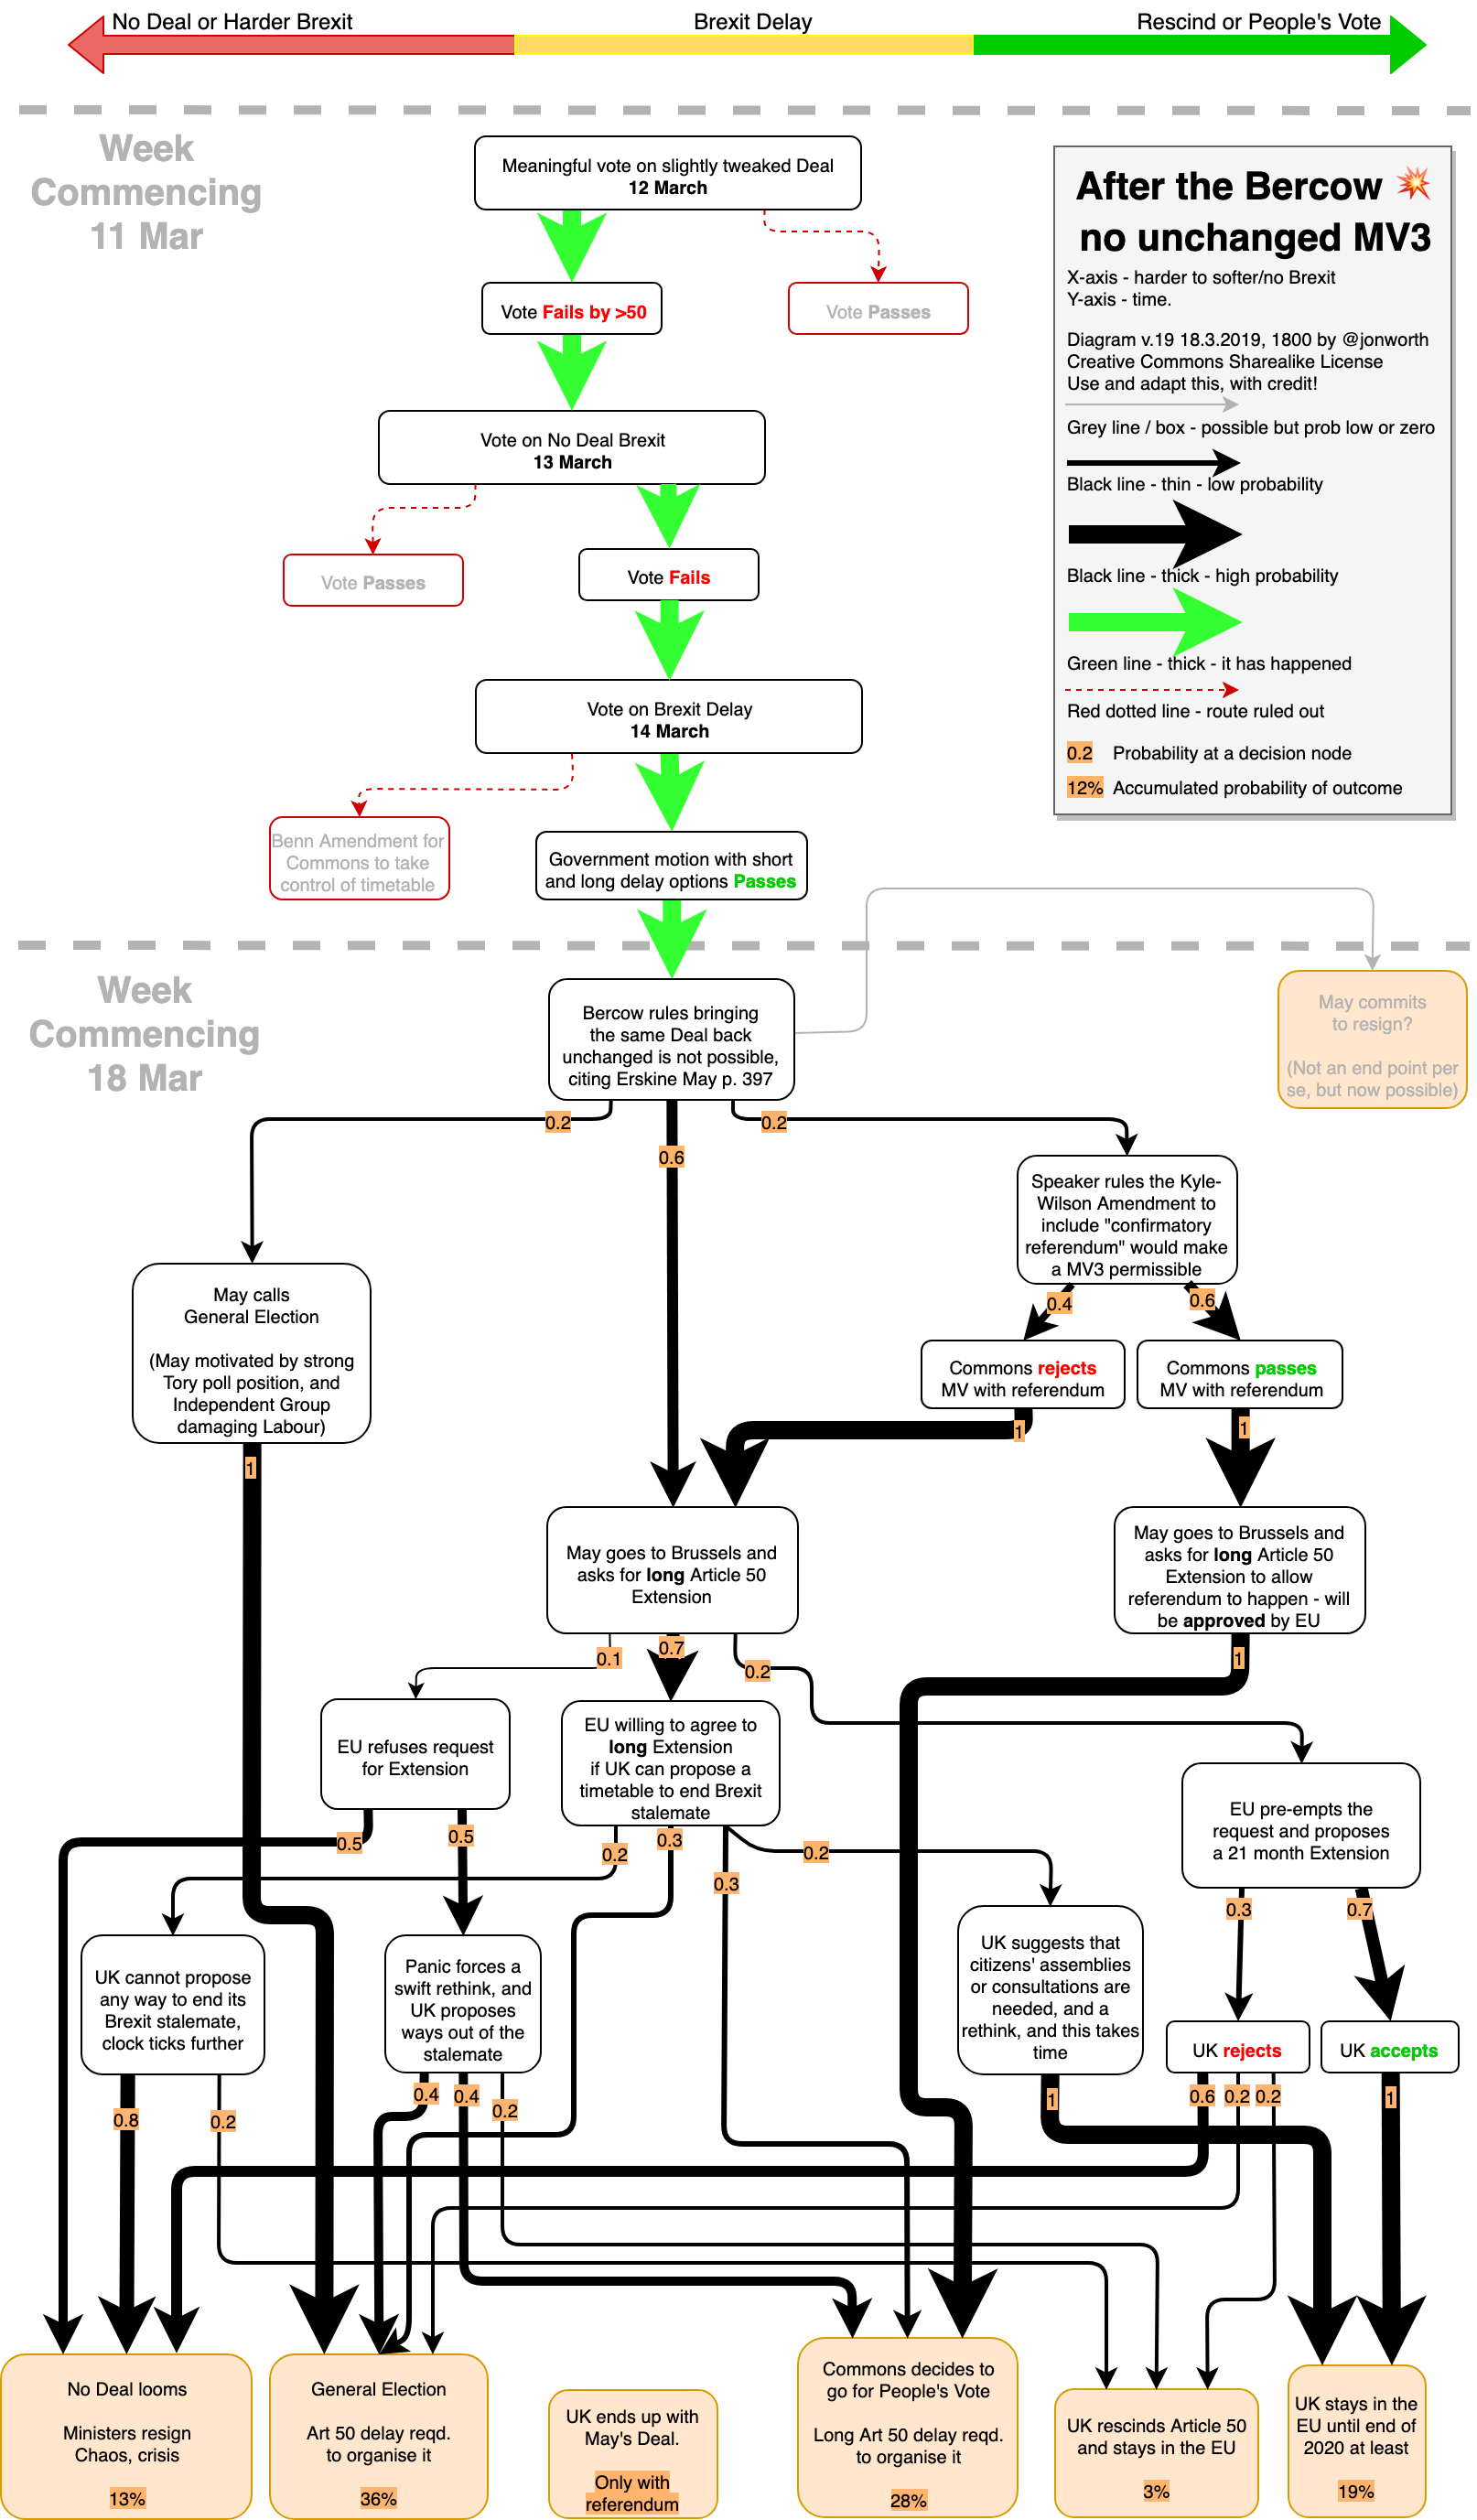
Version 19 – 15.3.2019, 1800
Post Bercow ruling out a Meaningful Vote on an unchanged Brexit Deal (but presuming the Kyle-Wilson Amended version would be allowed)
Version 18.1 – 15.3.2019, 1100
After all the votes 12-14 March.

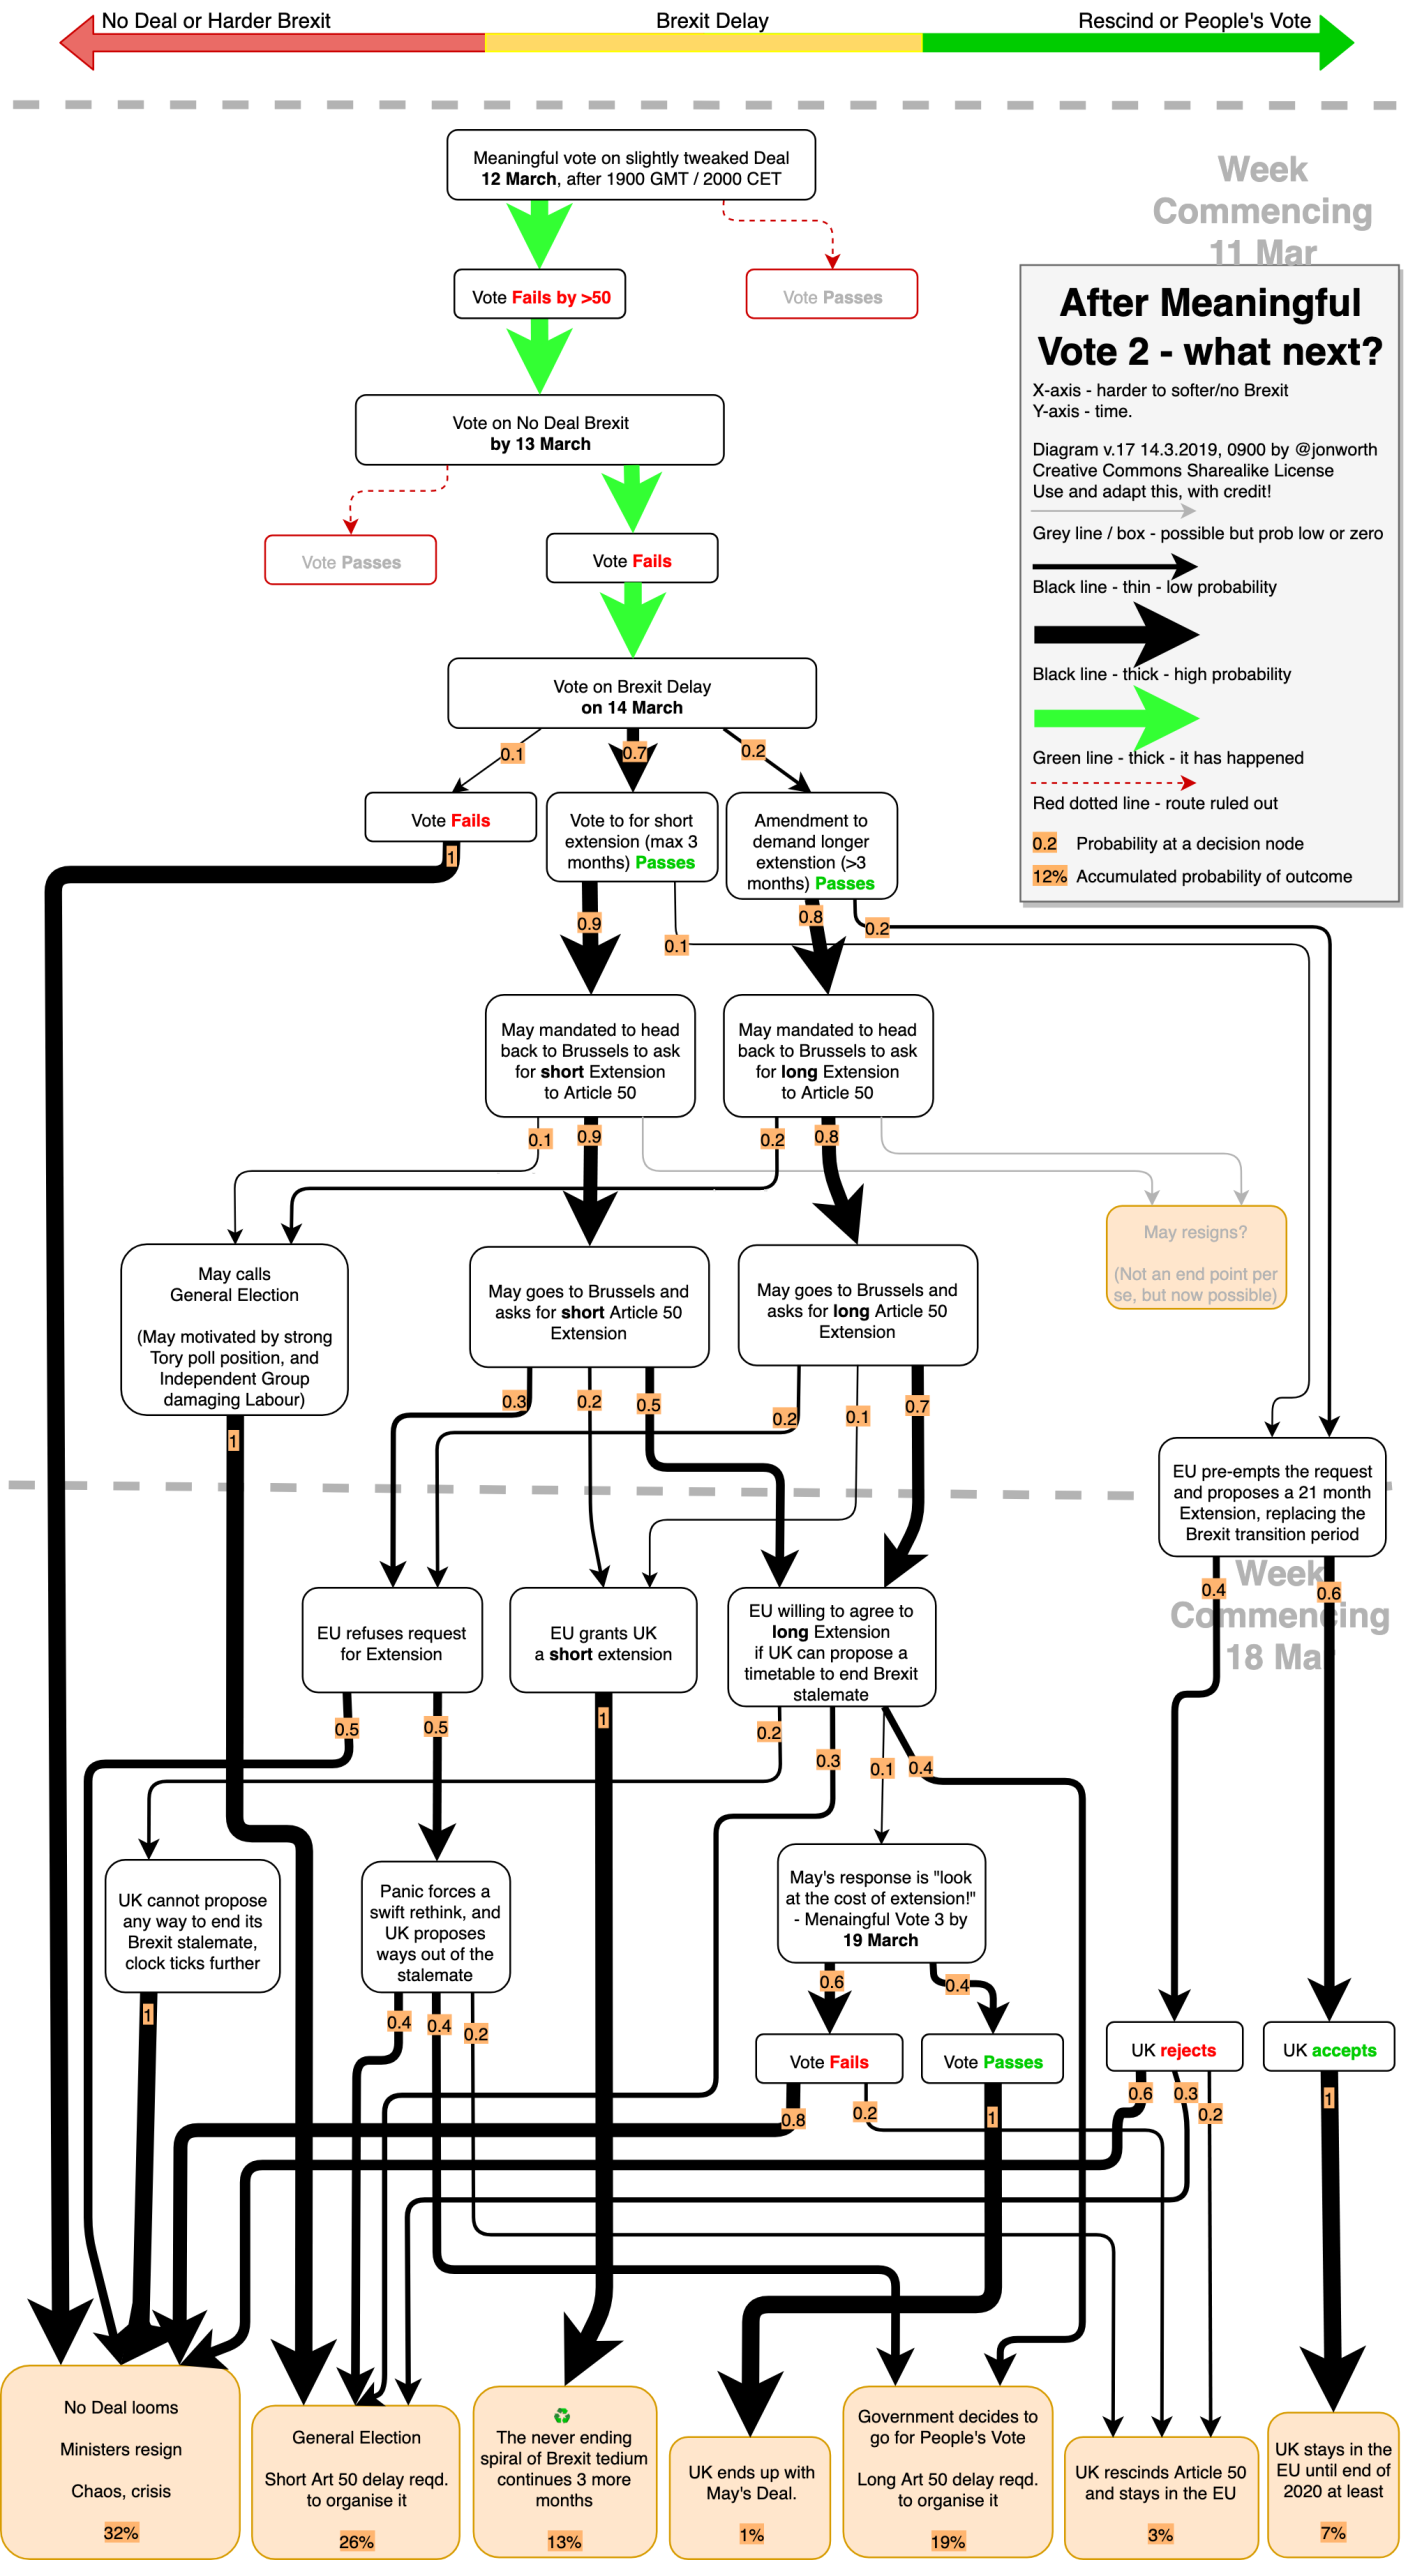
Version 17 – 14.3.2019, 0900
After the vote in the Commons to reject No Deal. But No Deal is still possible.
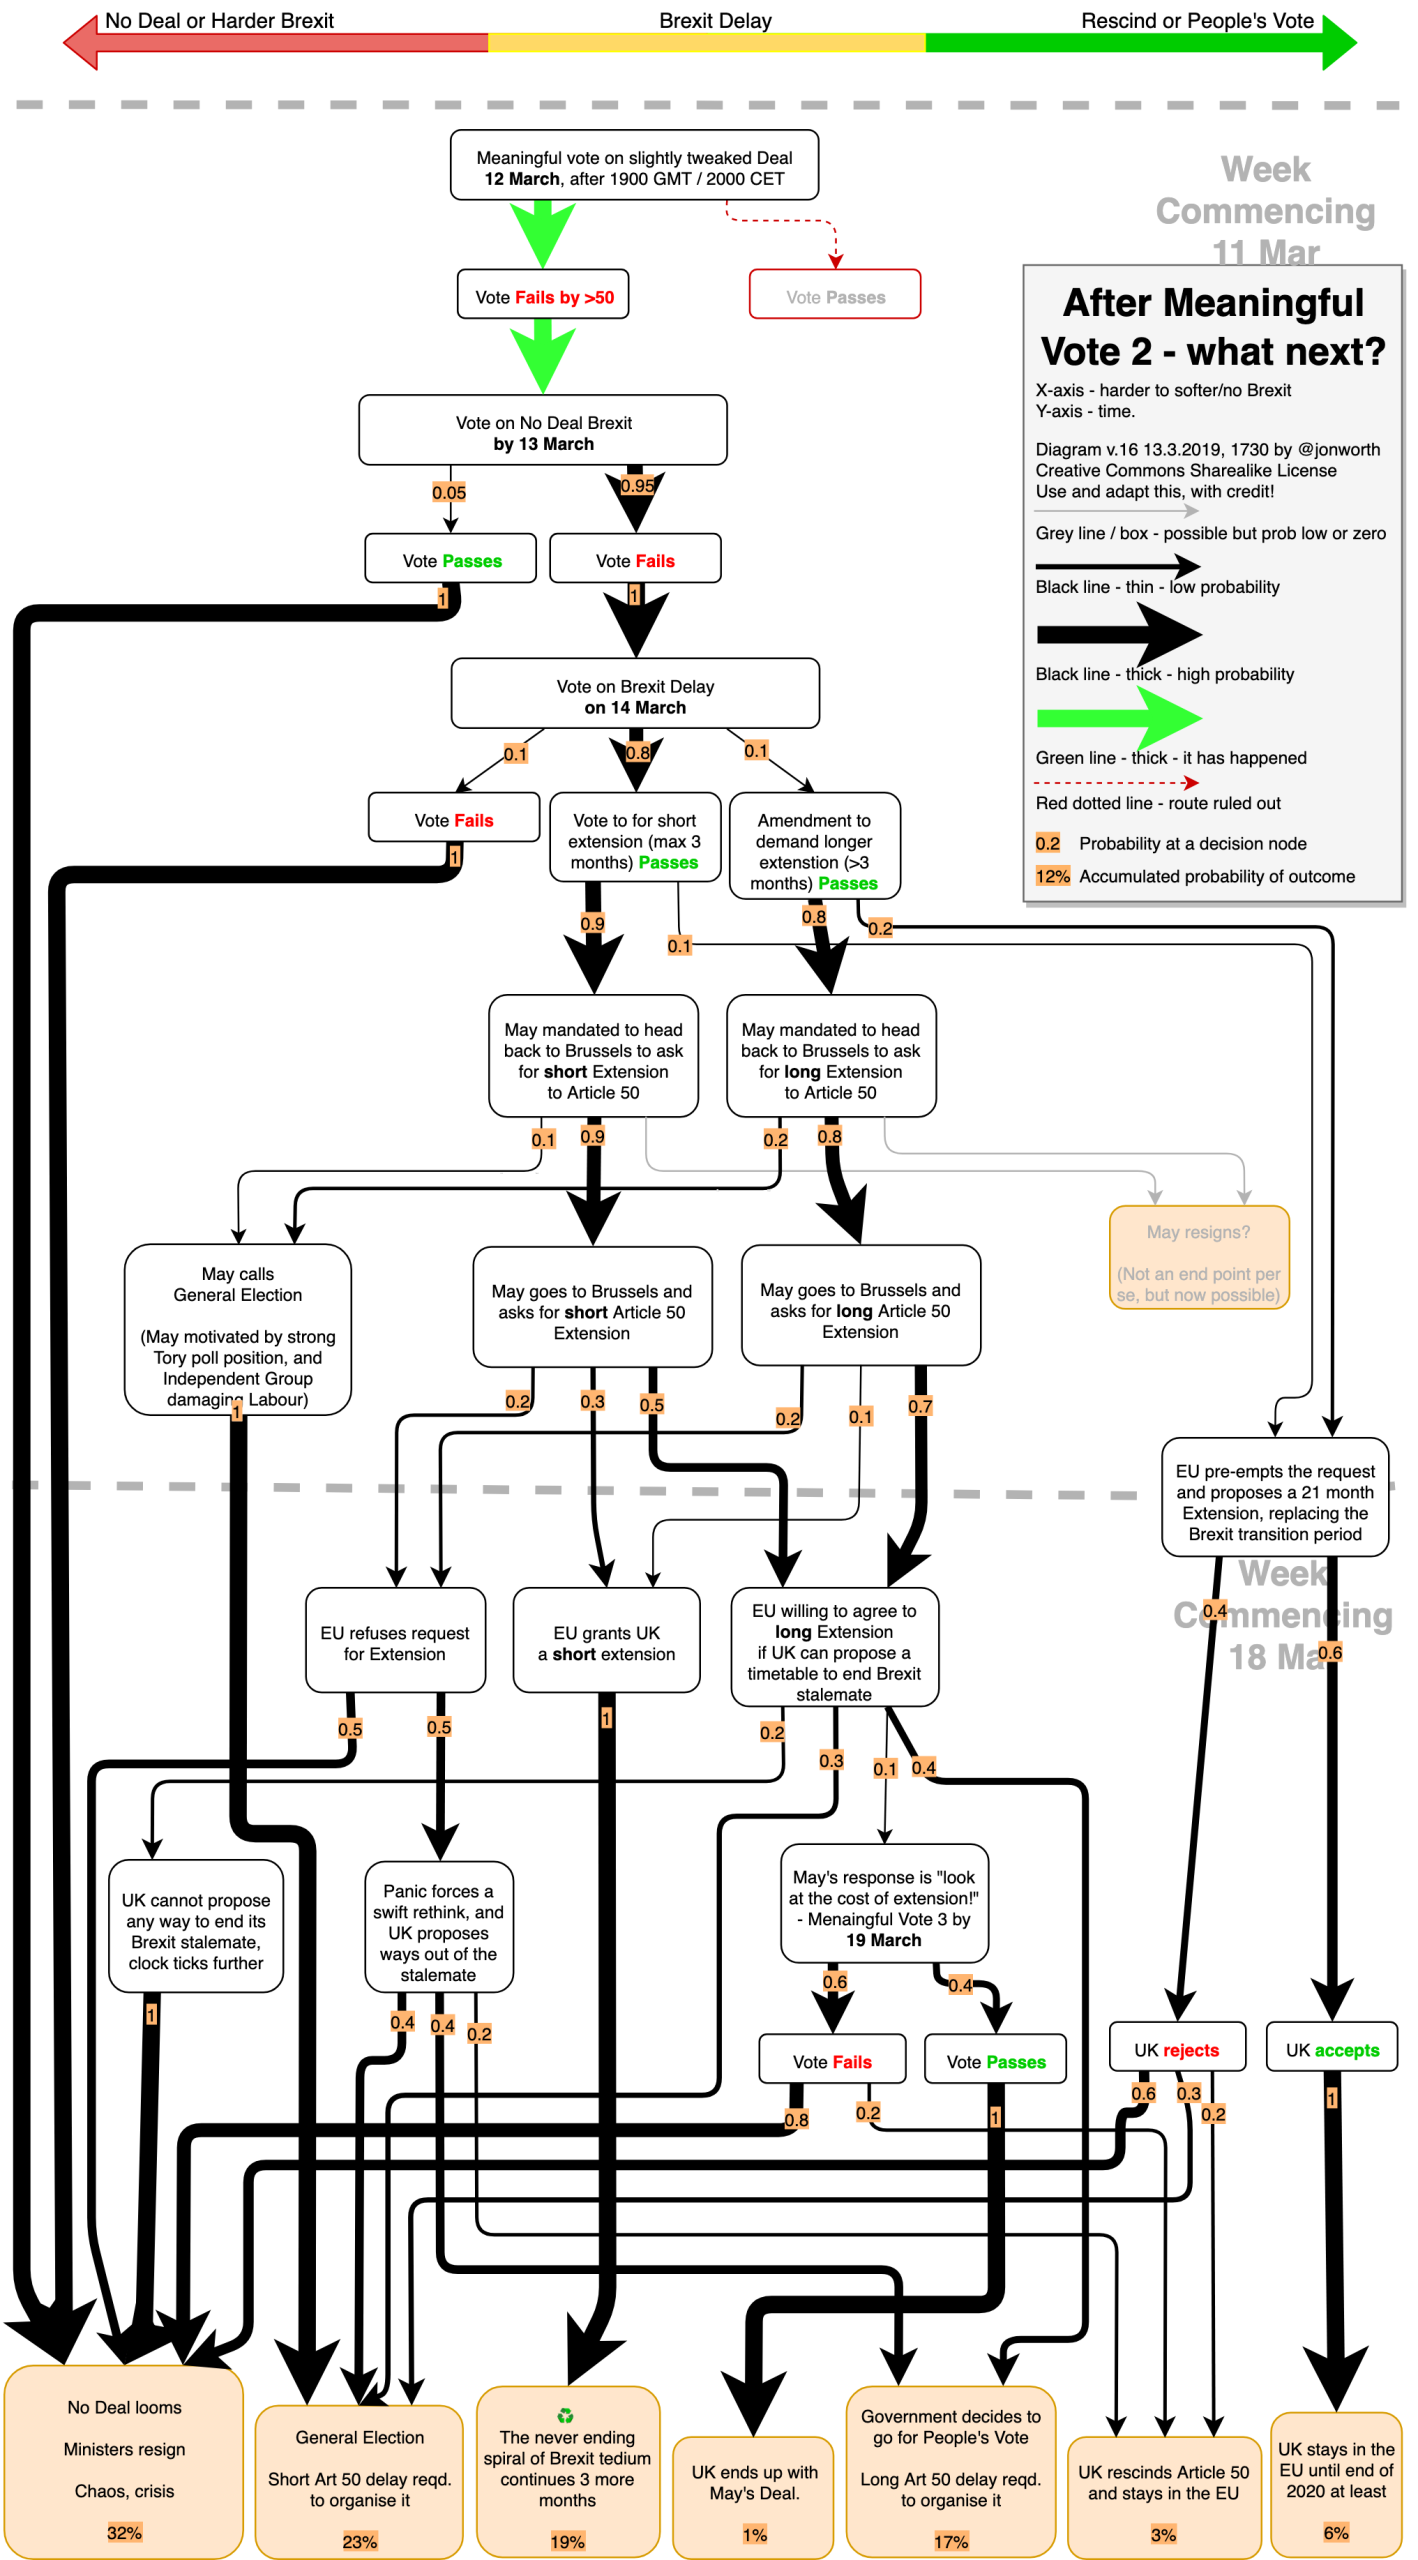
Version 16 – 13.3.2019, 1730
After Meaningful Vote 2.
Version 15.1 – 12.3.2019, 1445
Before Meaningful Vote 2. After Cox said “legal risk remains unchanged”

Version 14 – 7.3.2019, 1720
Adding the prospect of a 3rd “Meaningful Vote”.

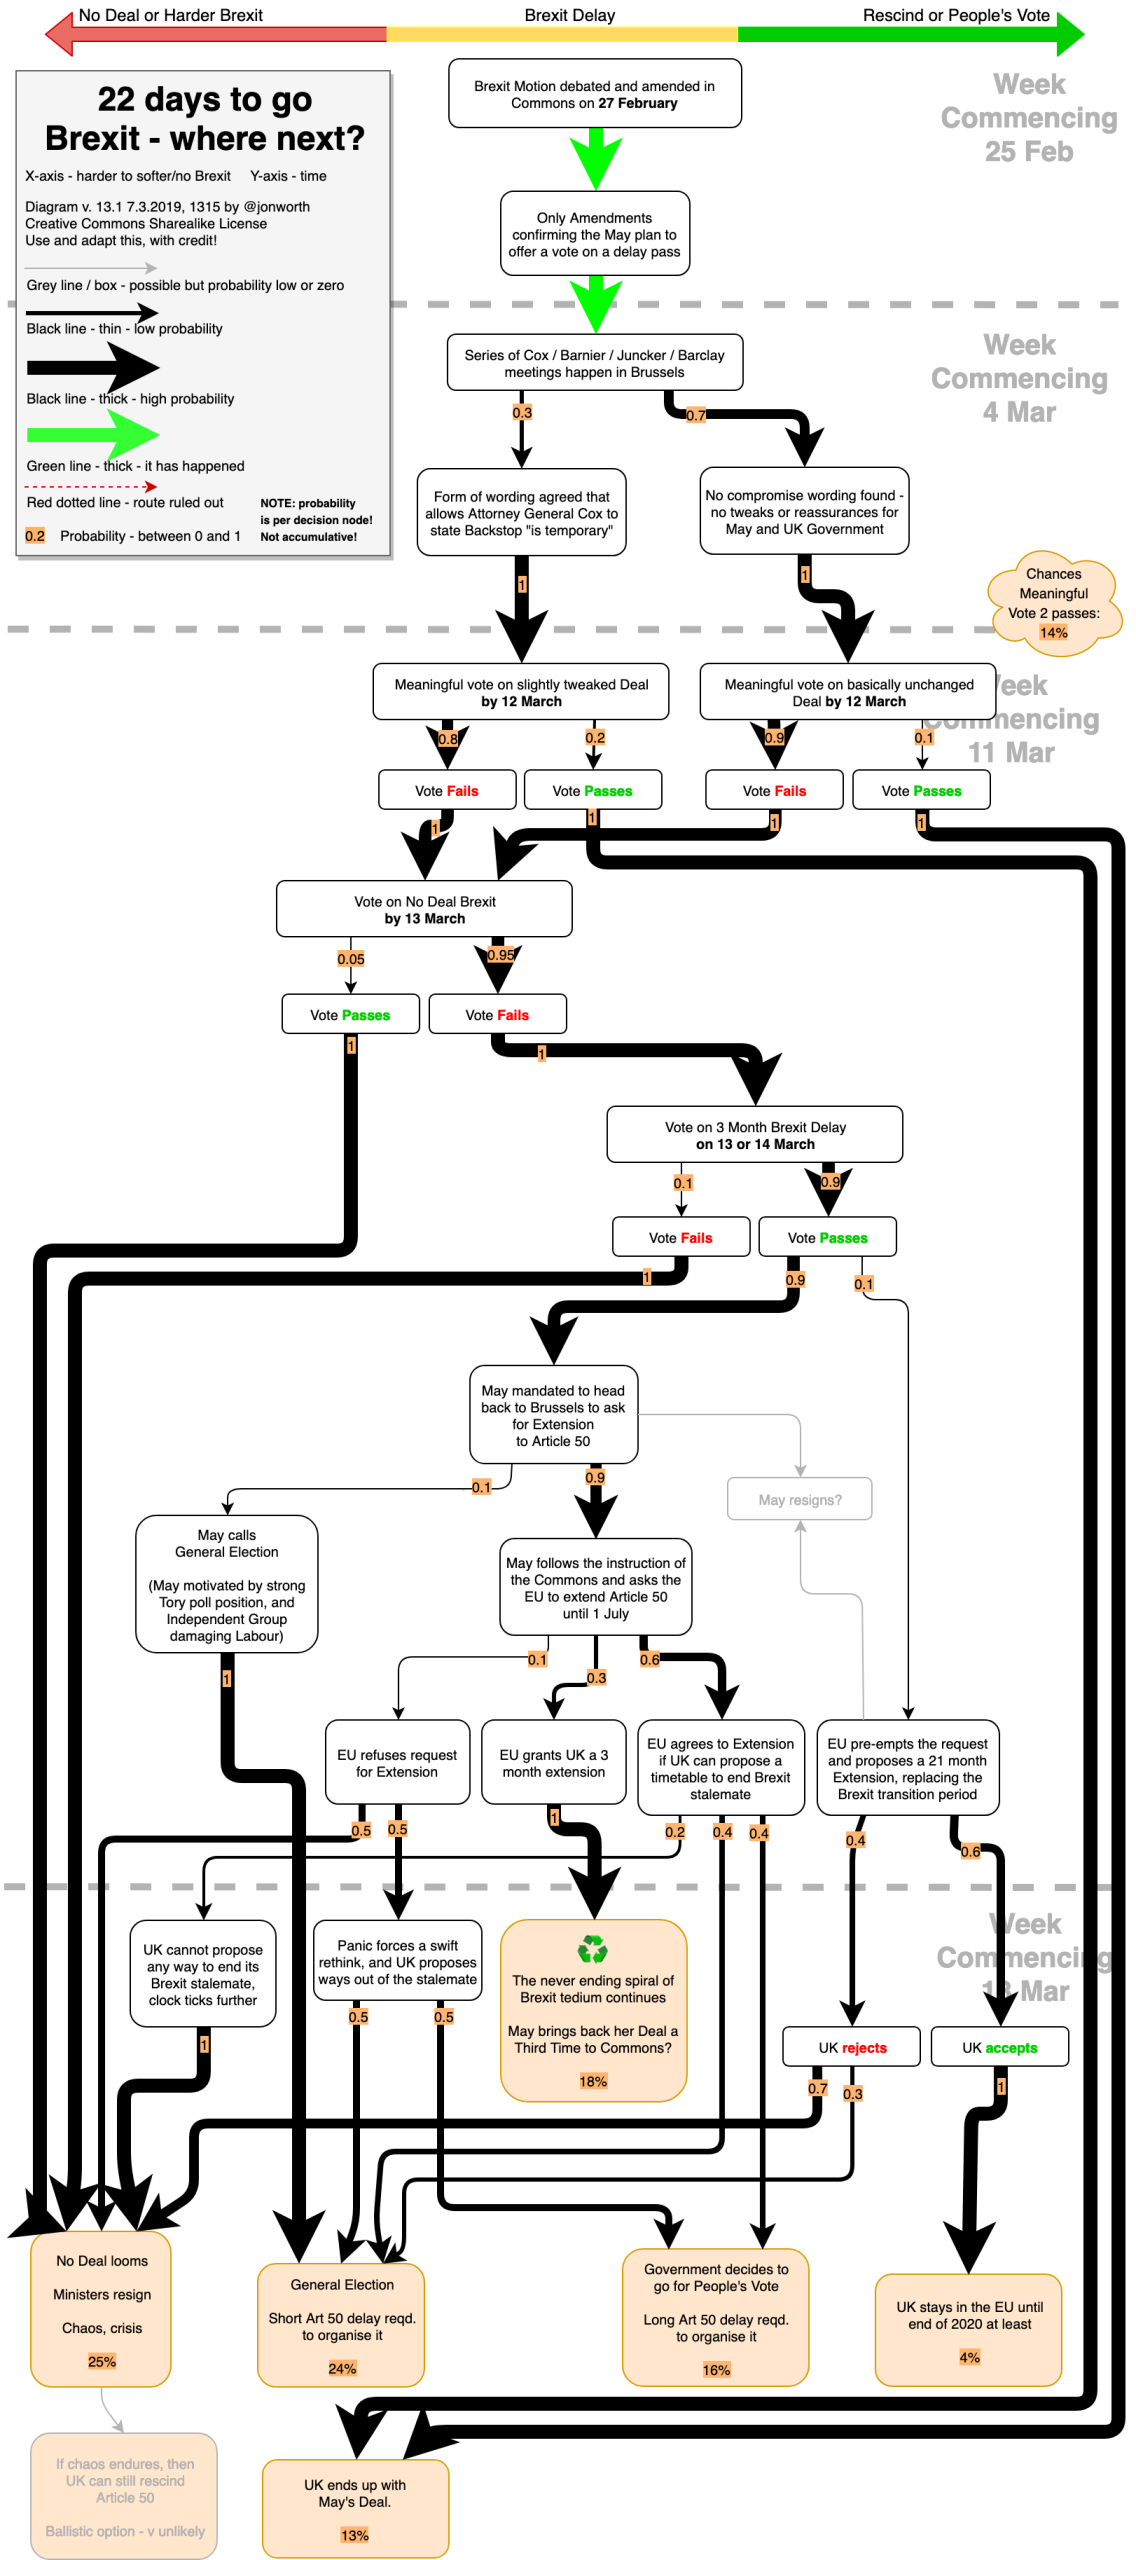
Version 13.1 – 7.3.2019, 1315
Adjusting accumulative probabilities, and adjustments at the top based on the news that there has been no progress in Brussels this week.
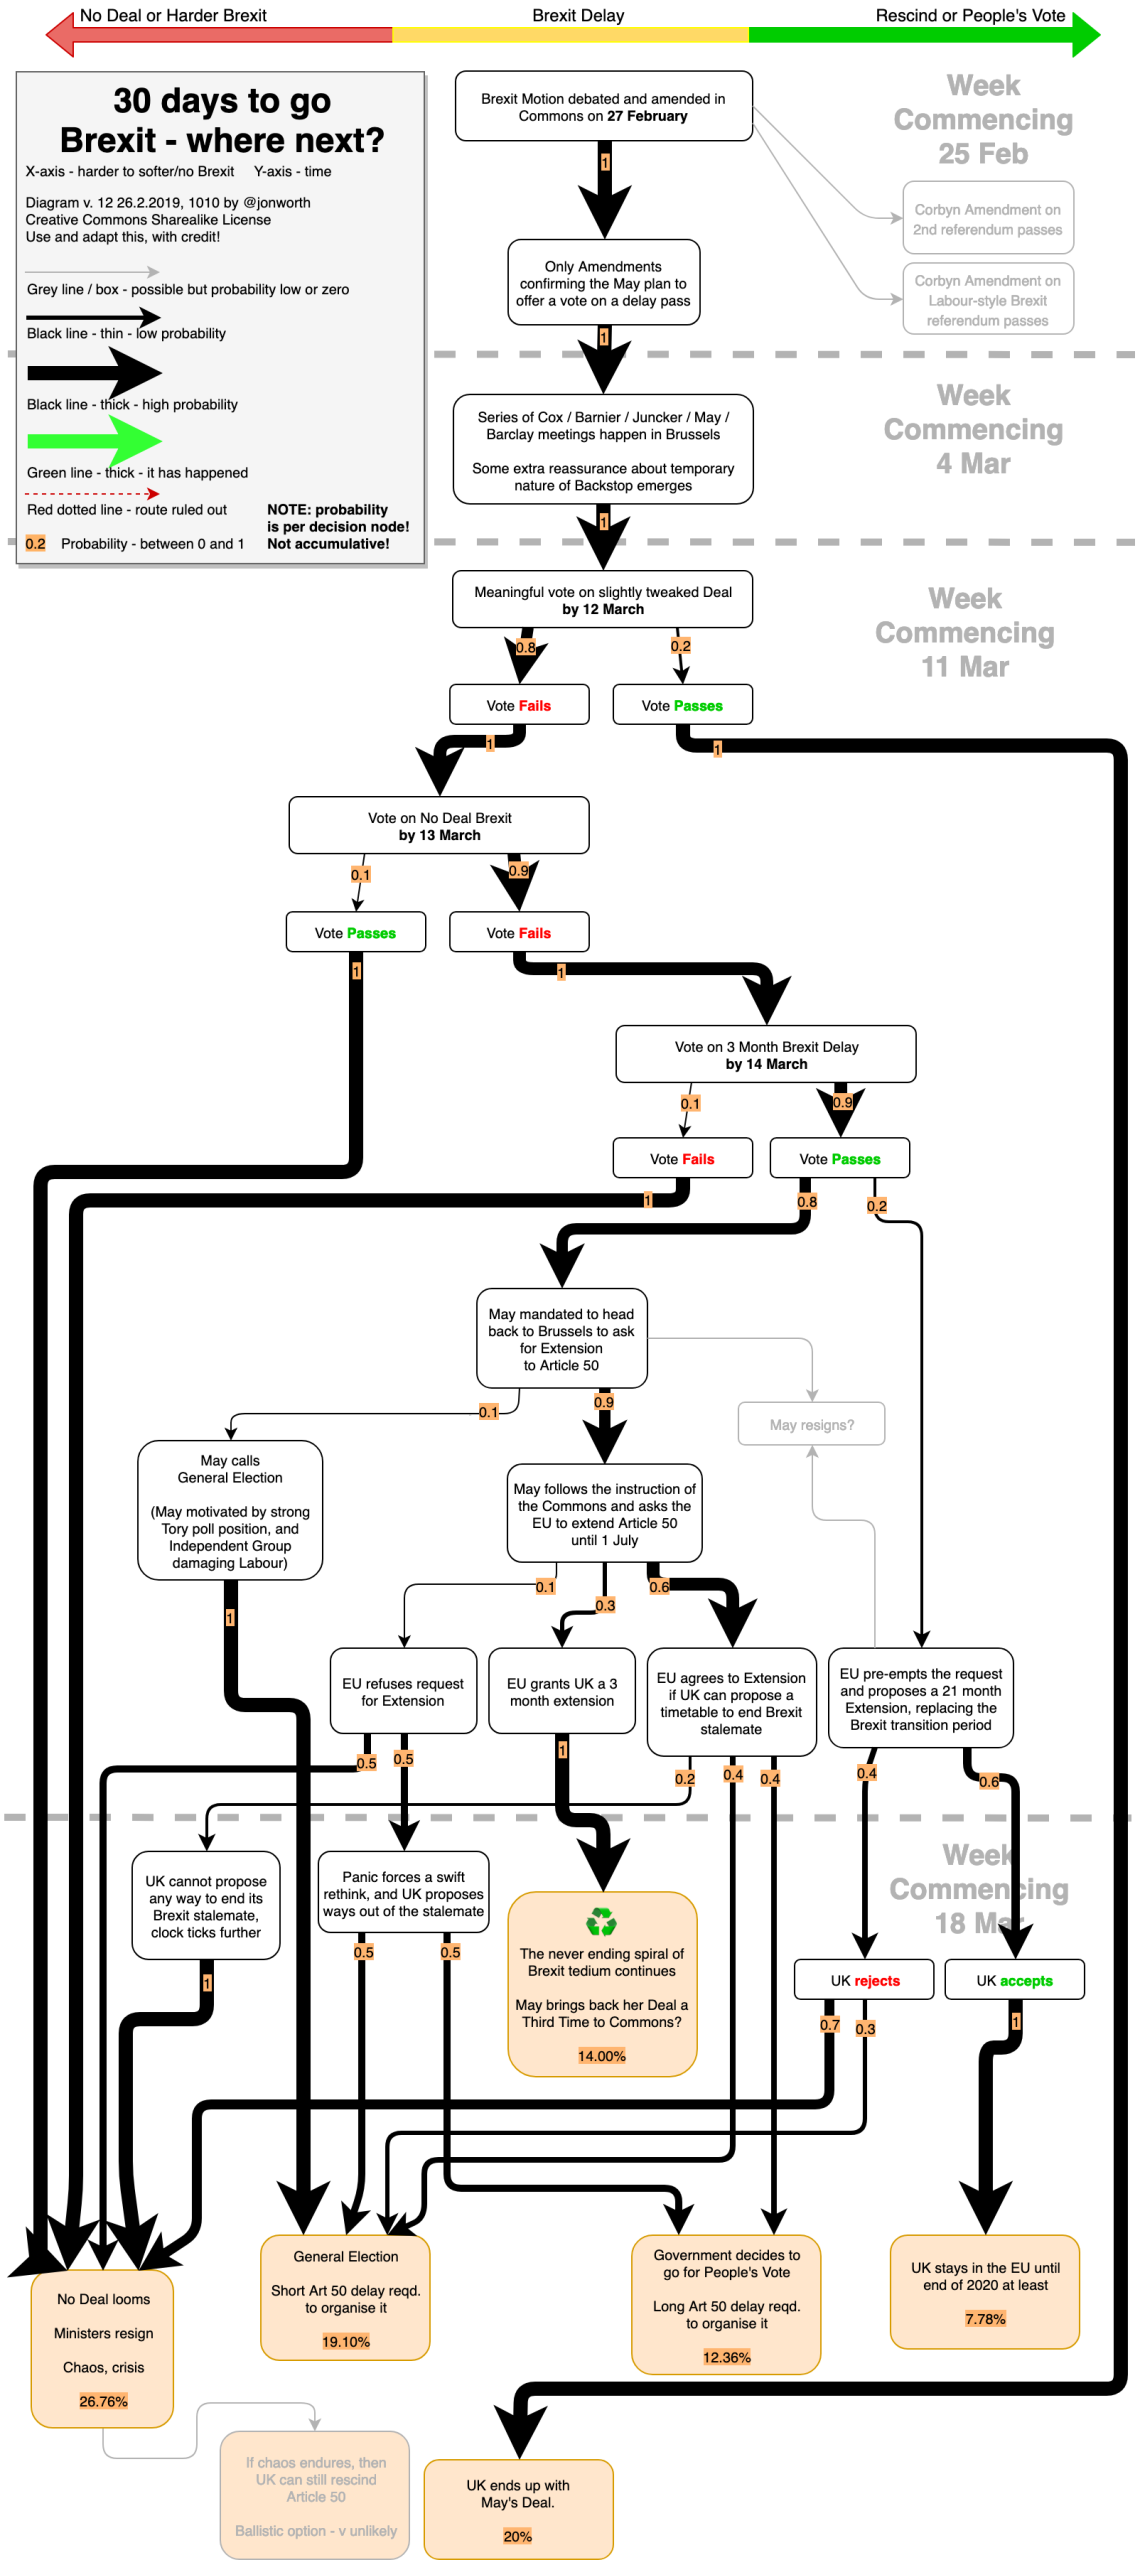
Version 12 – 27.2.2019, 1000
Adding accumulative probabilities, and adding the idea that the EU might pre-emptively offer the UK an extension. Design also more compact.
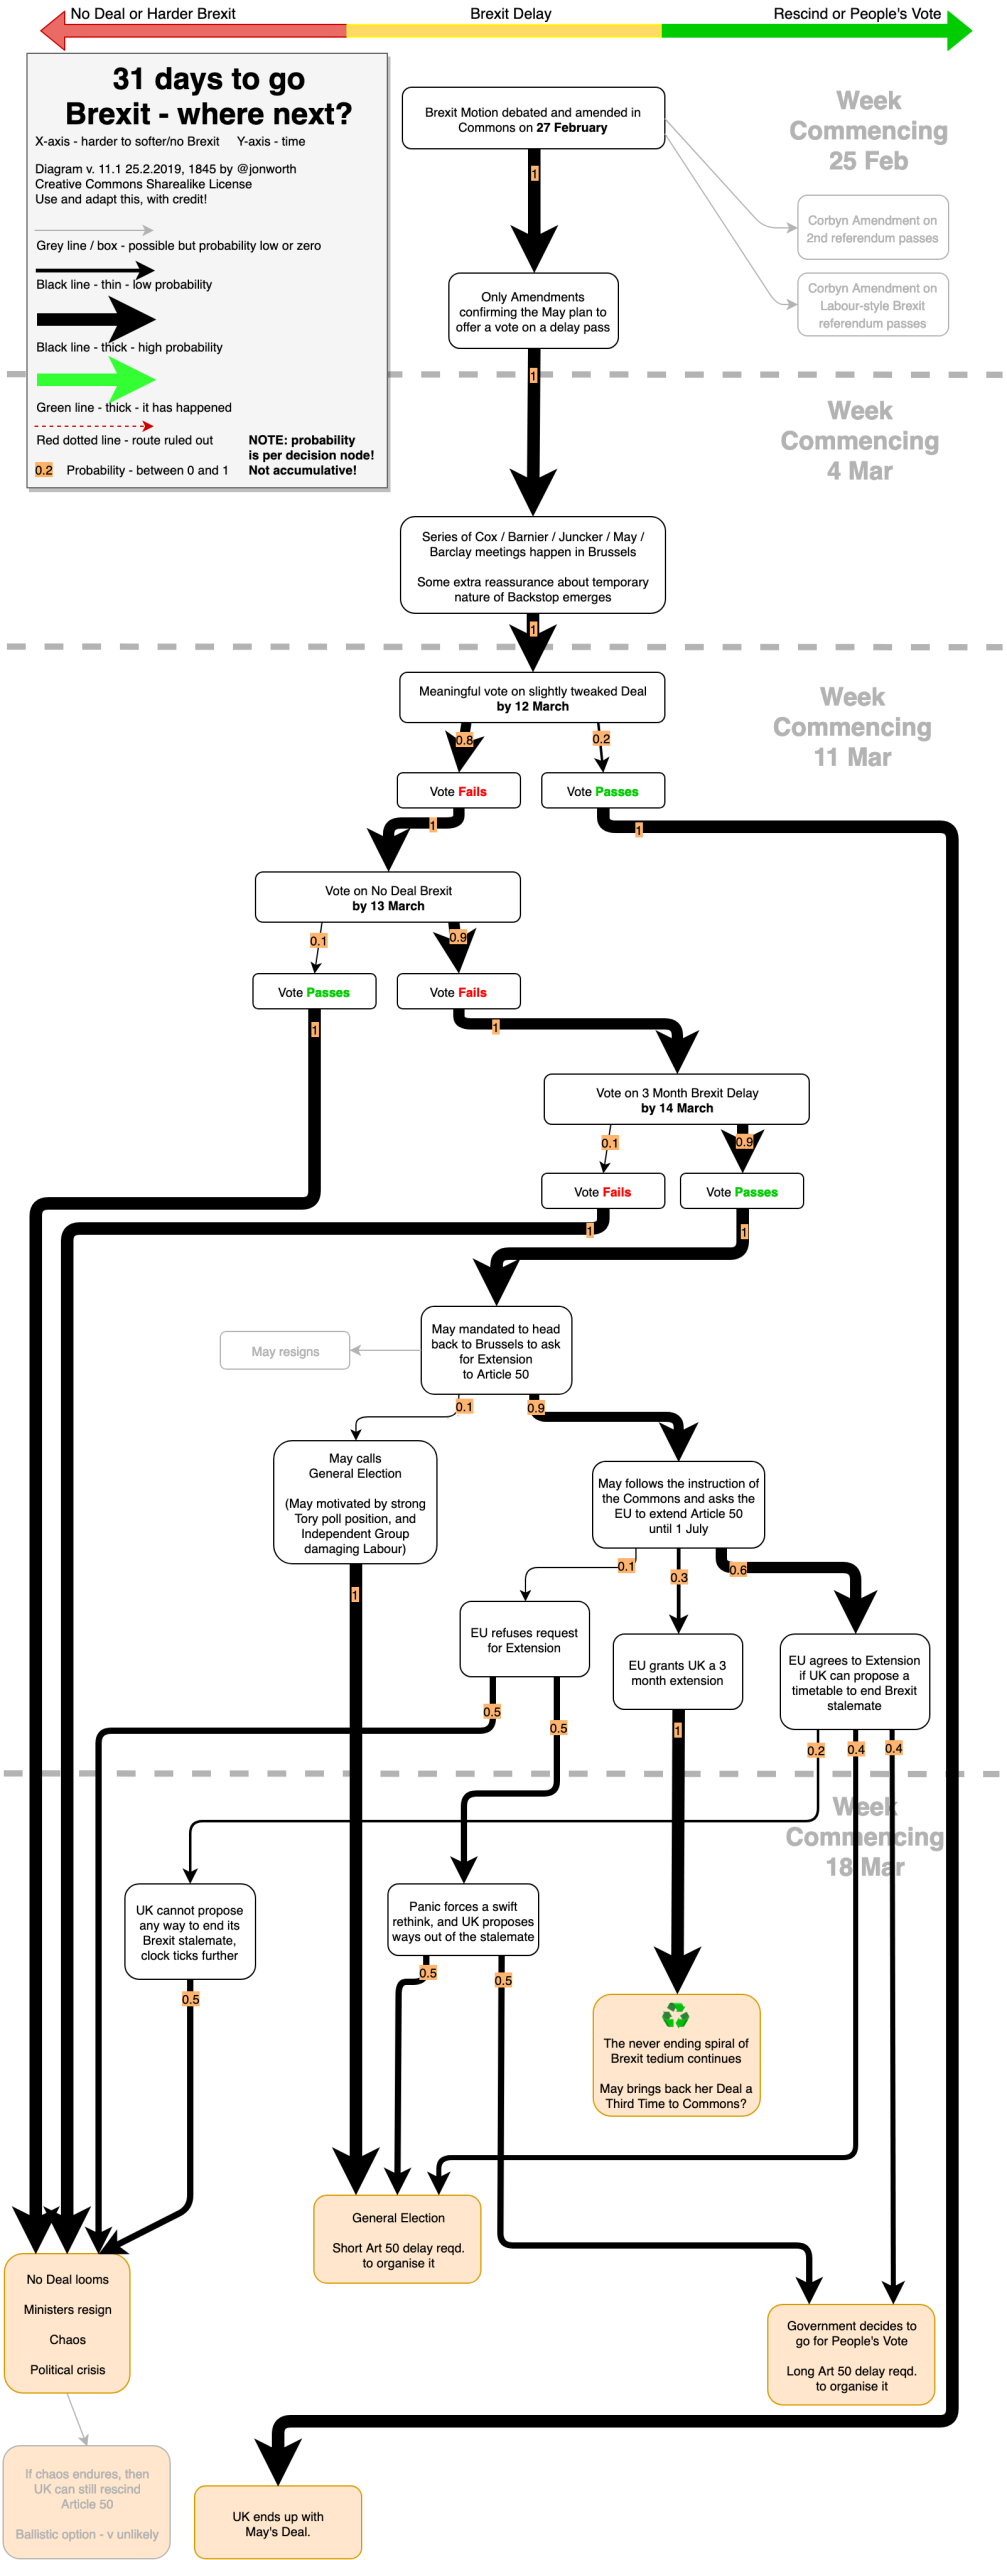
Version 11 – 26.2.2019, 1830
Cooper-Letwin Amendment withdrawn
Version 10 – 25.2.2019, 2120
Incorporating Corbyn backing a People’s Vote

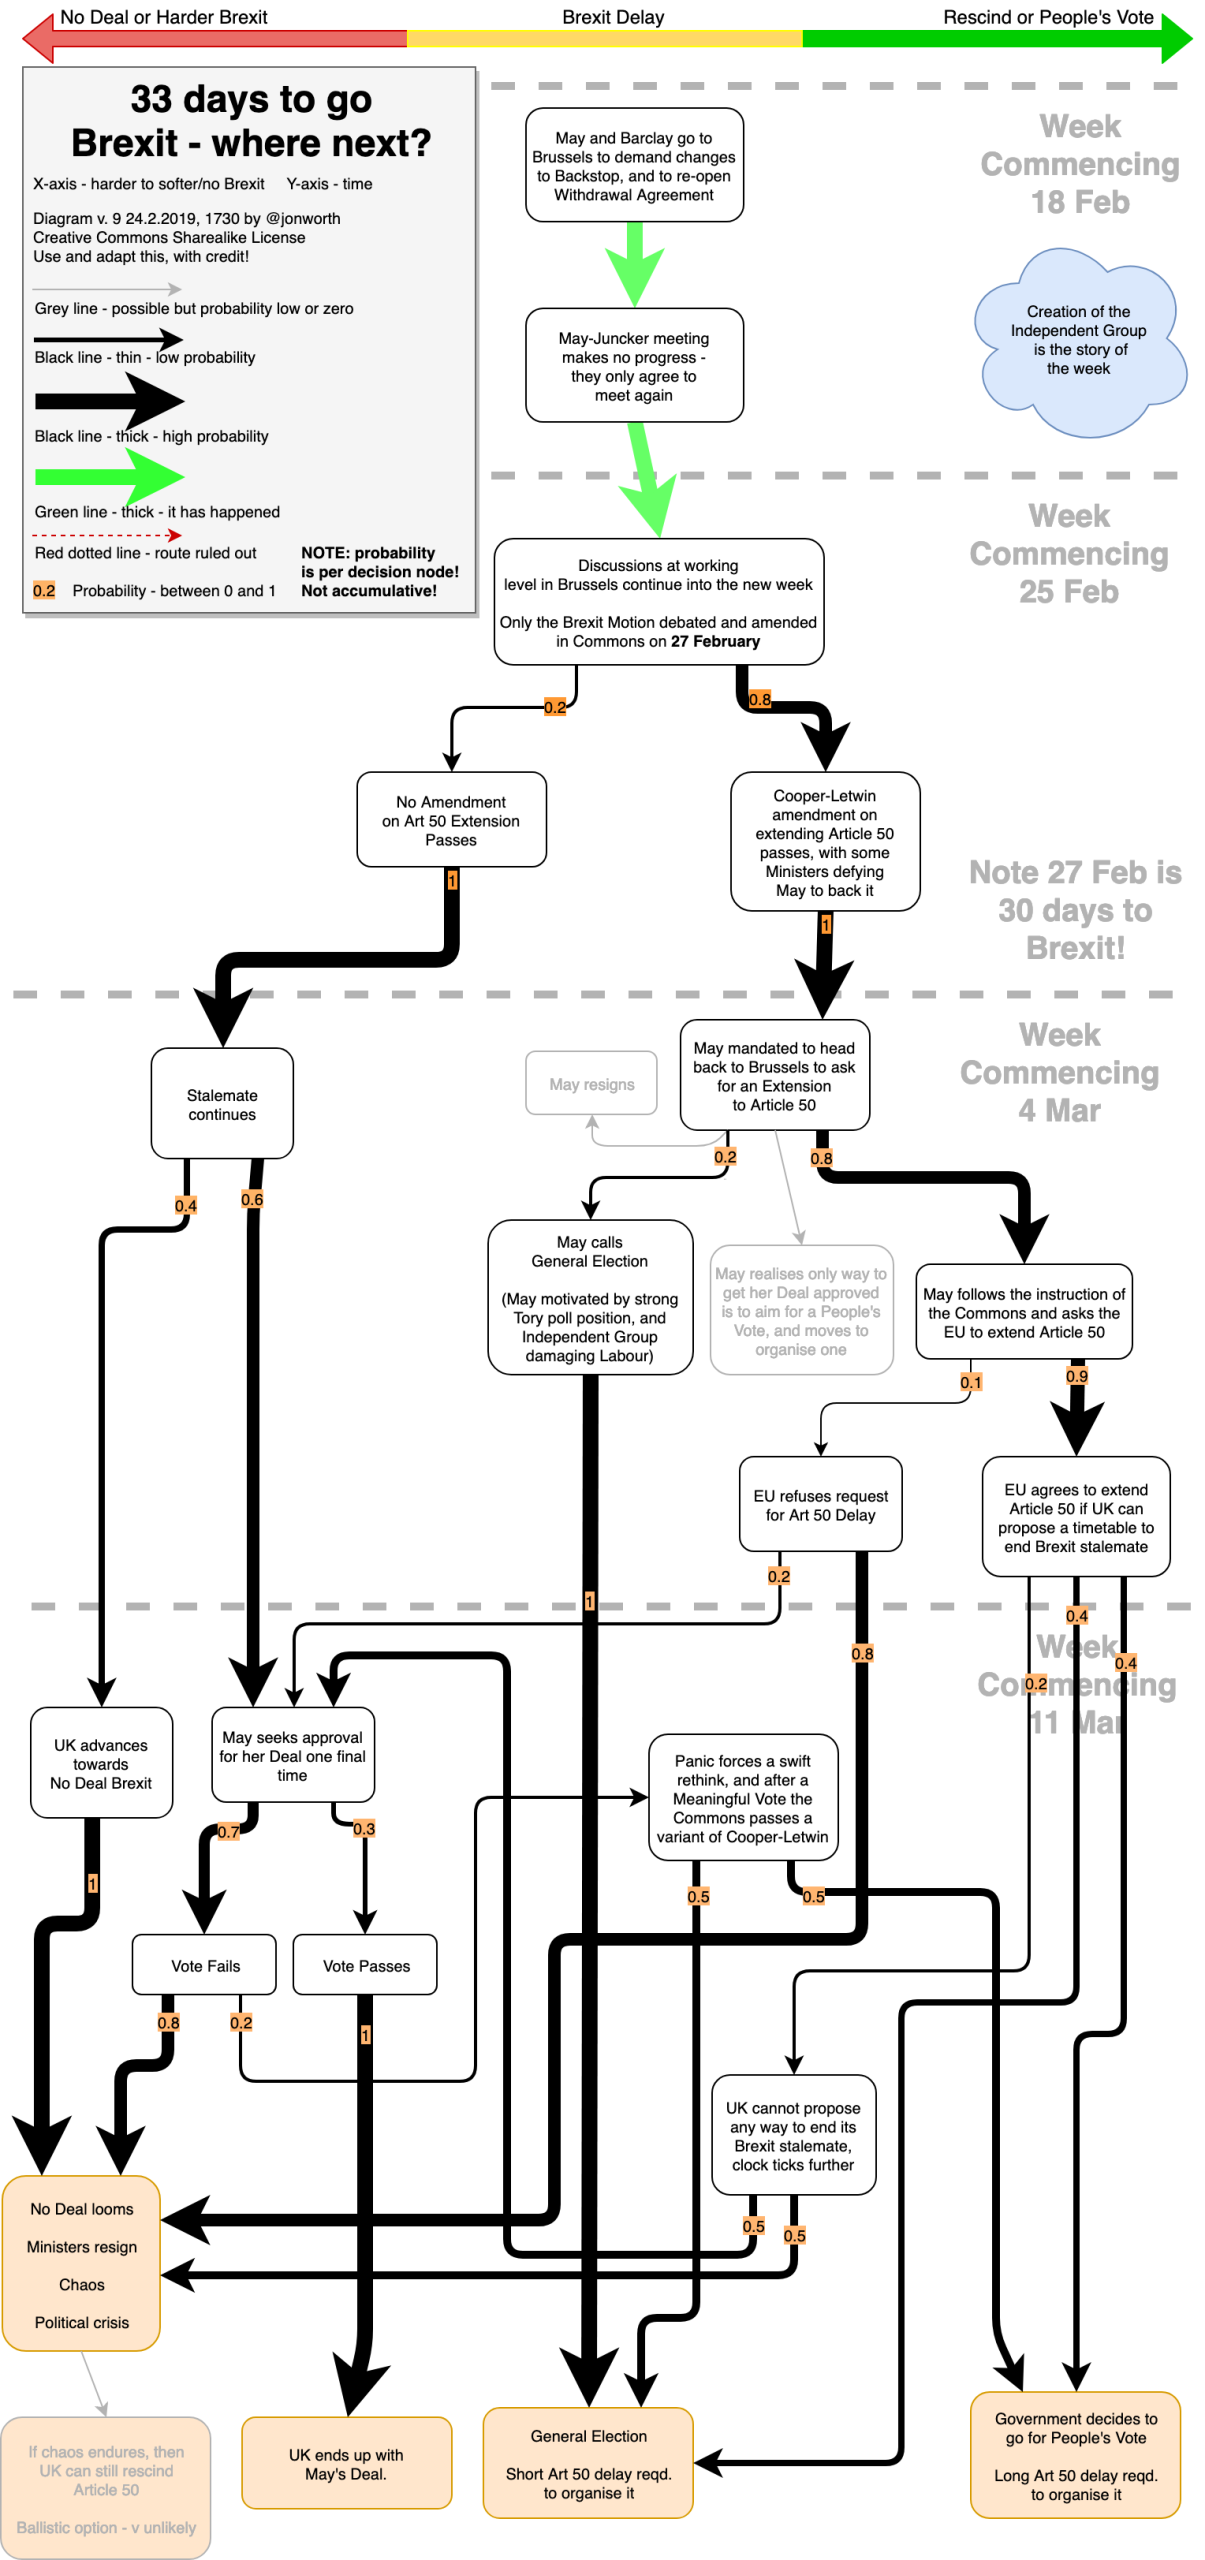
Version 9 – 24.2.2019, 1730
So May has said there will be no Meaningful Vote in February. So there’s a new diagram!
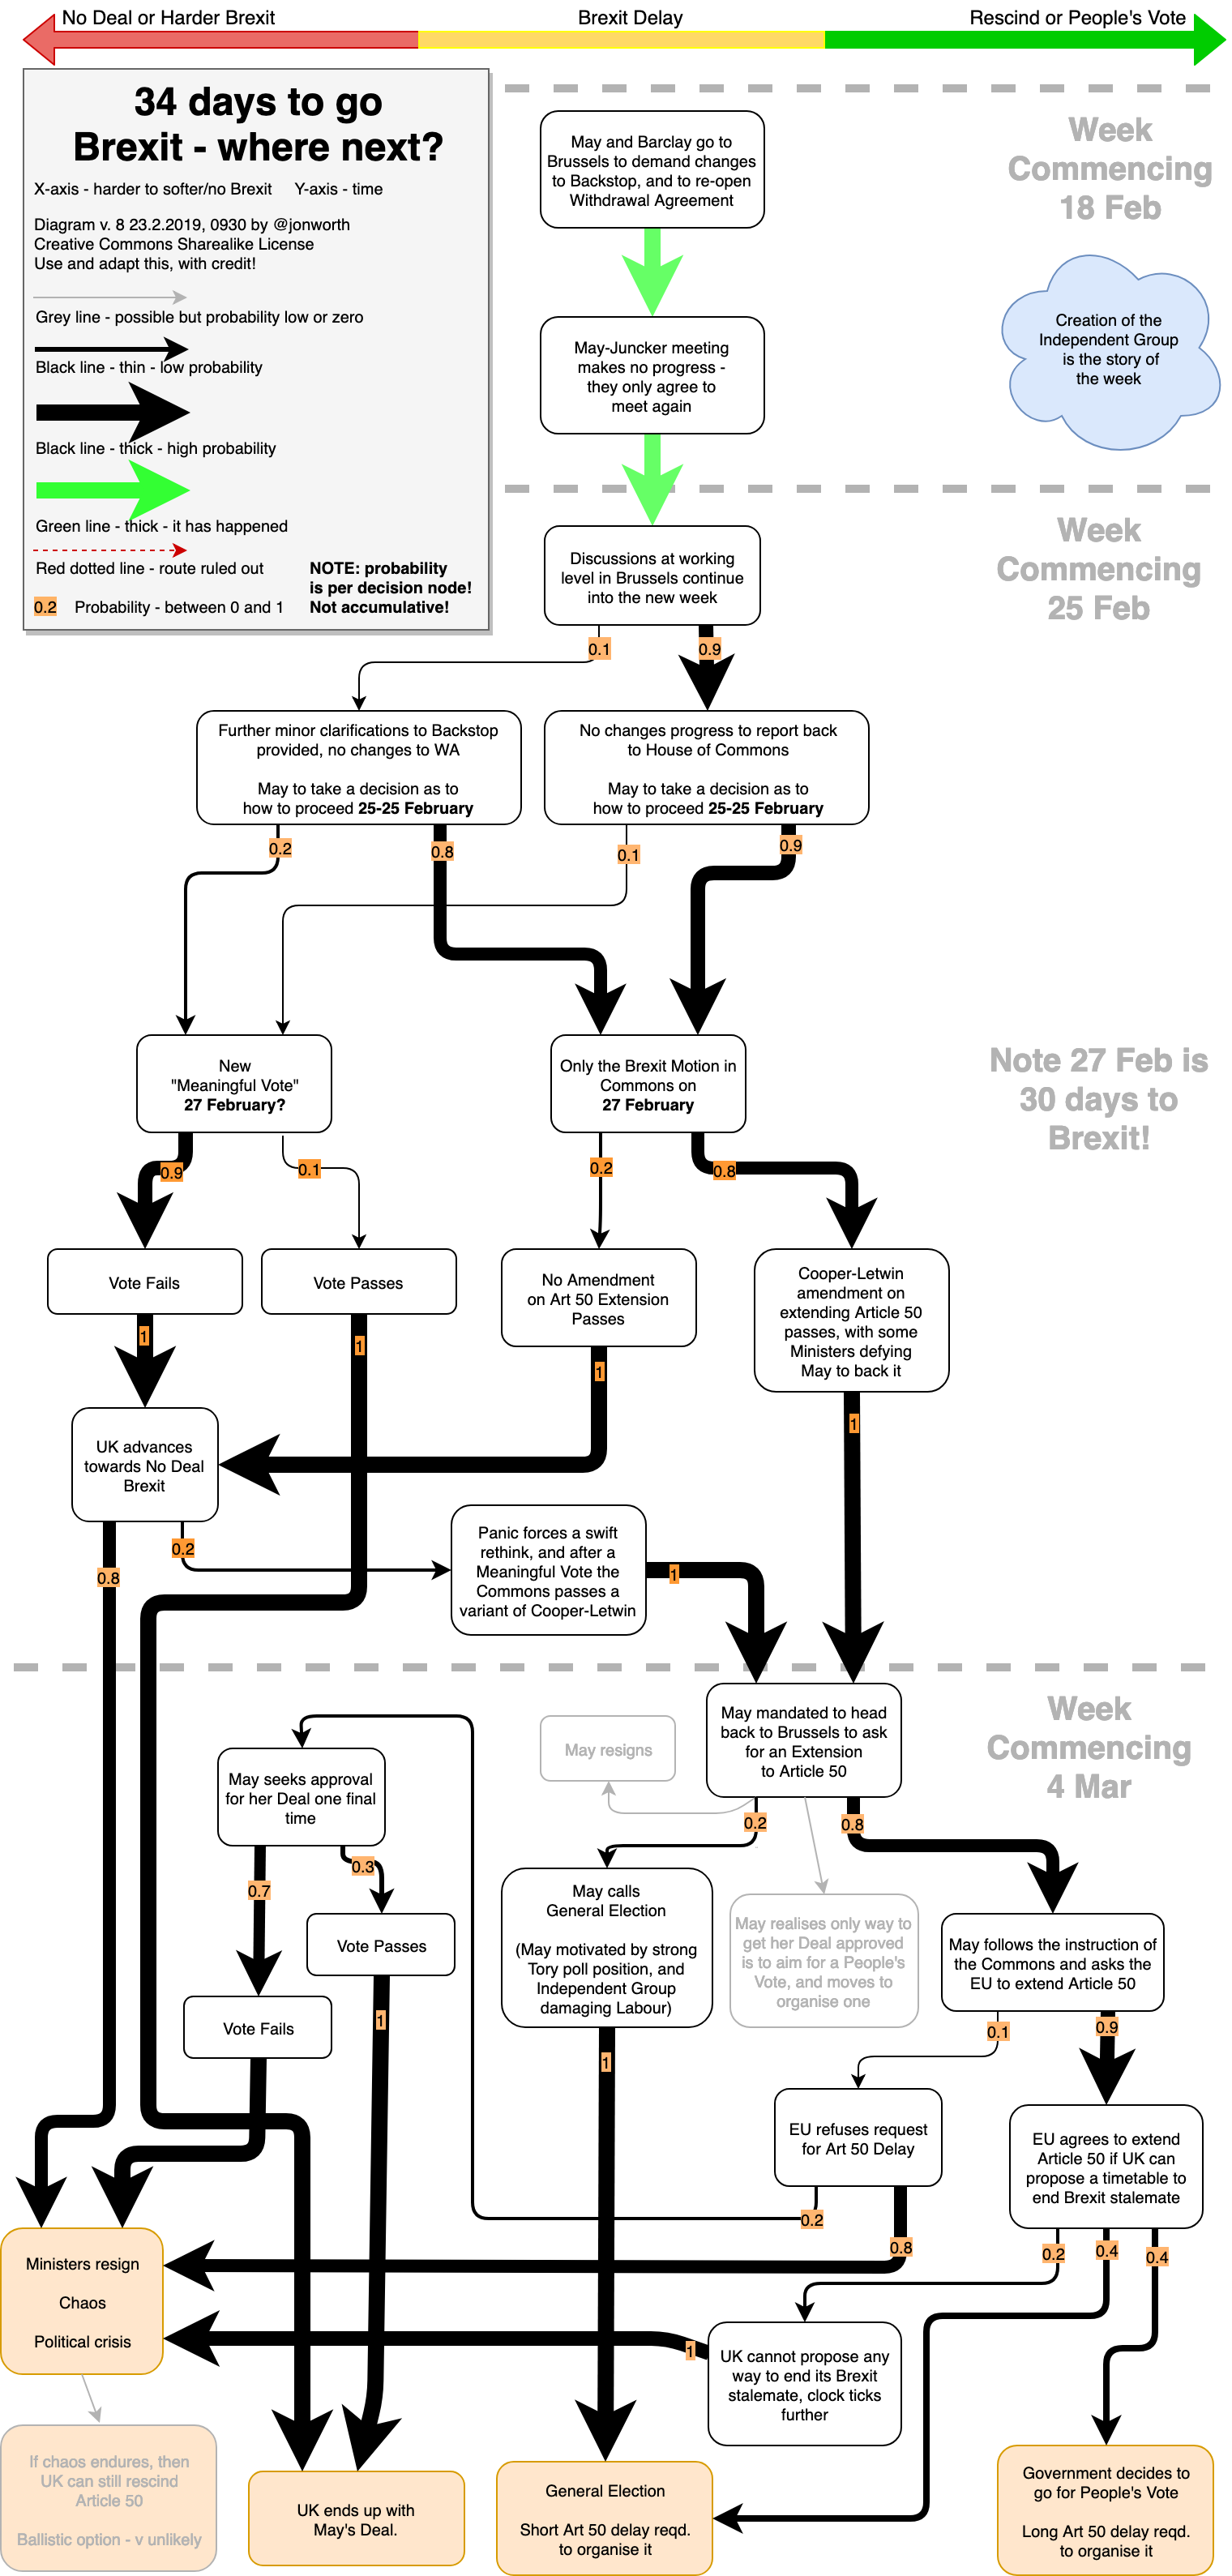
Version 8 – 23.2.2019, 0900
This one takes into account the emergence of the Indepedent Group, and what might happen if and when the UK requests an extension of Article 50
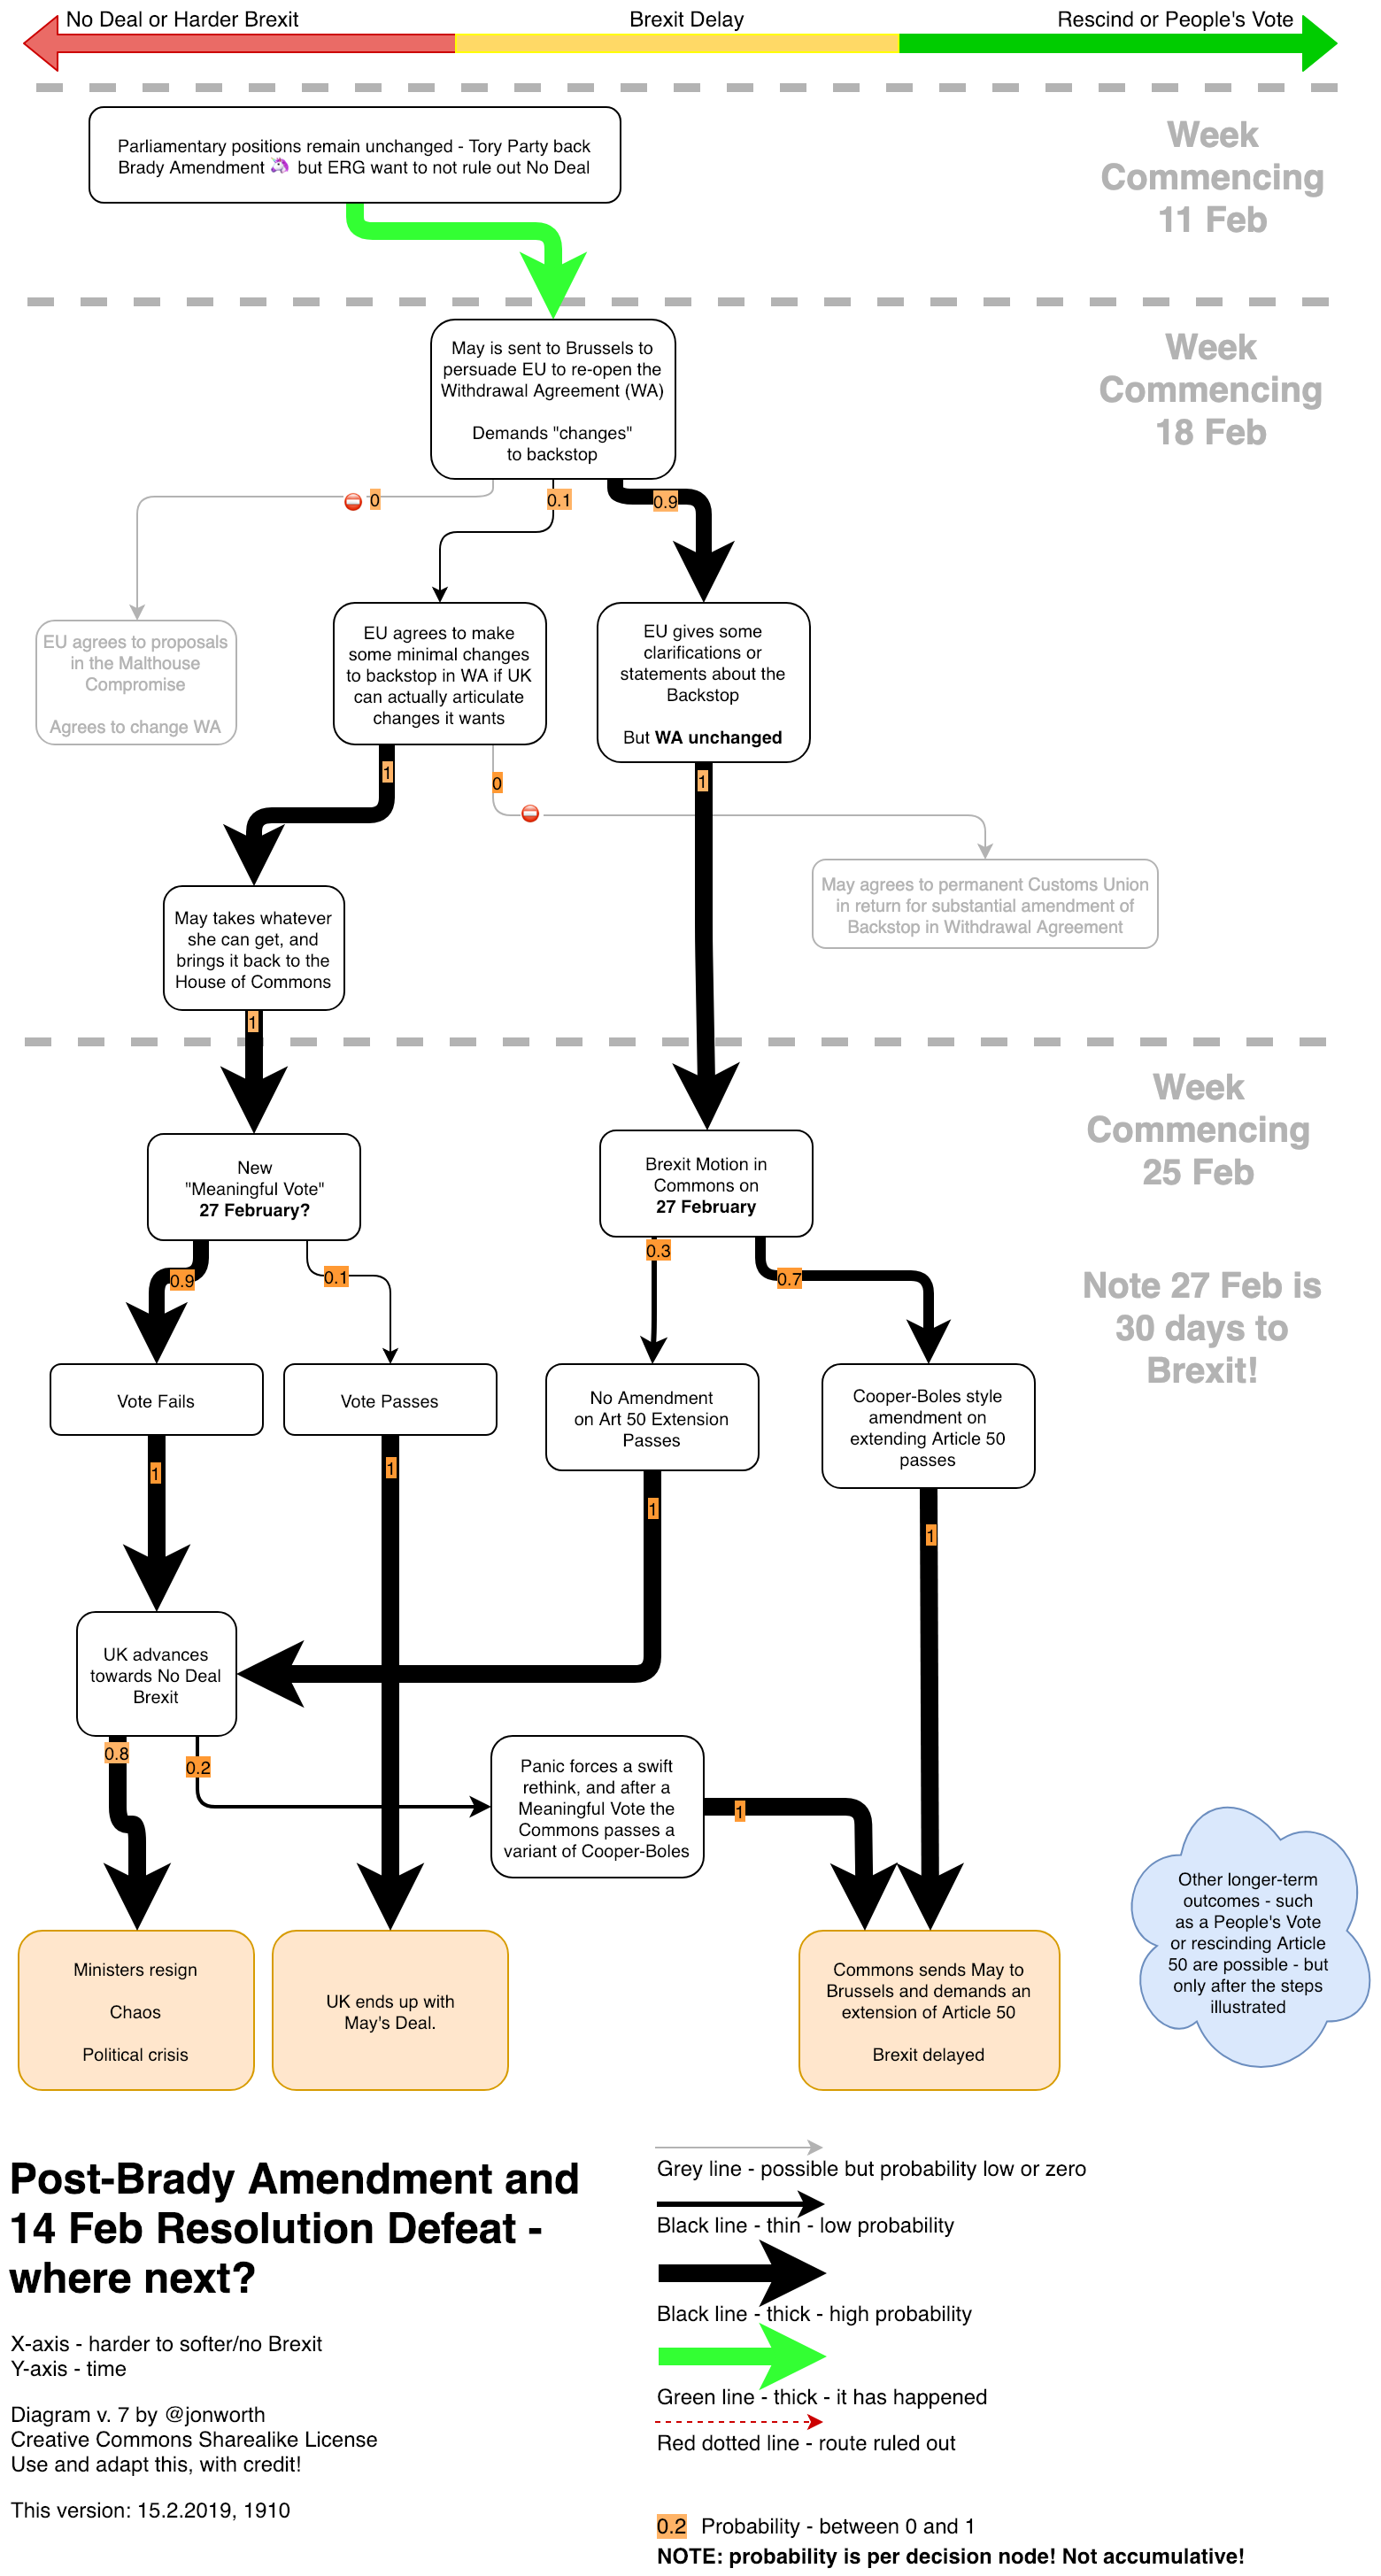
Version 7 – 15.2.2019, 1910
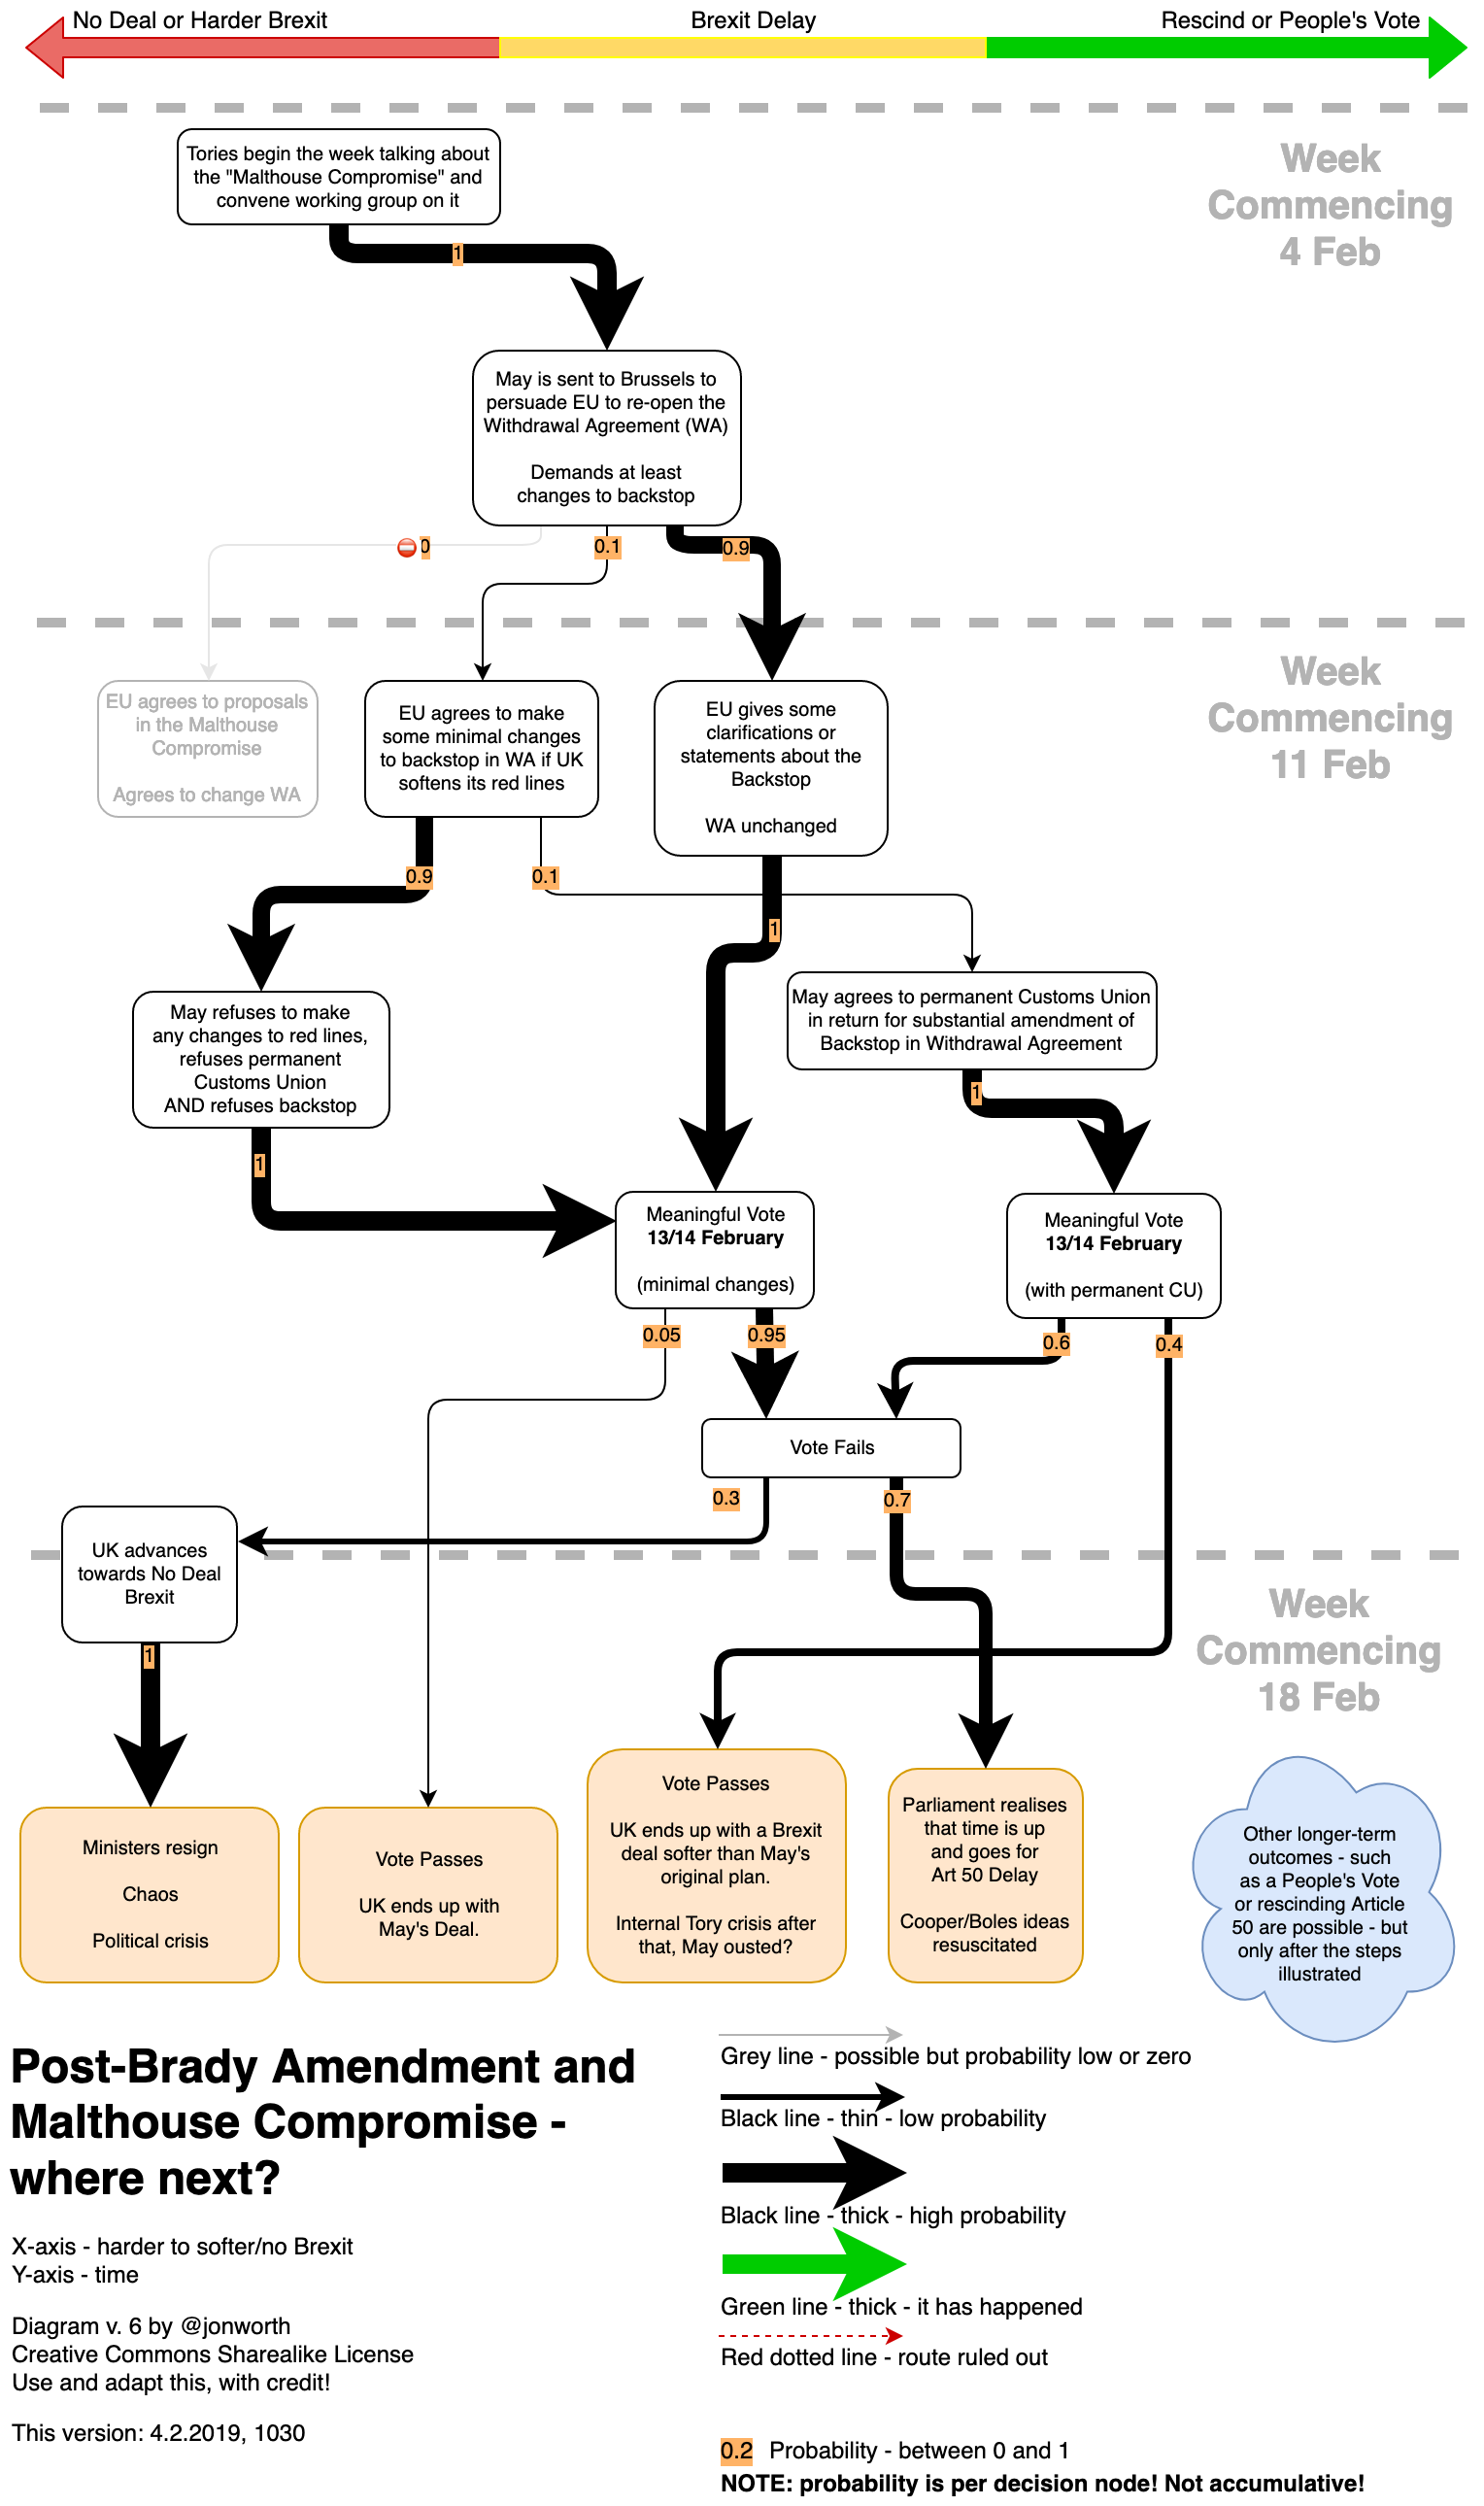
Version 6 – 4.2.2019, 1030
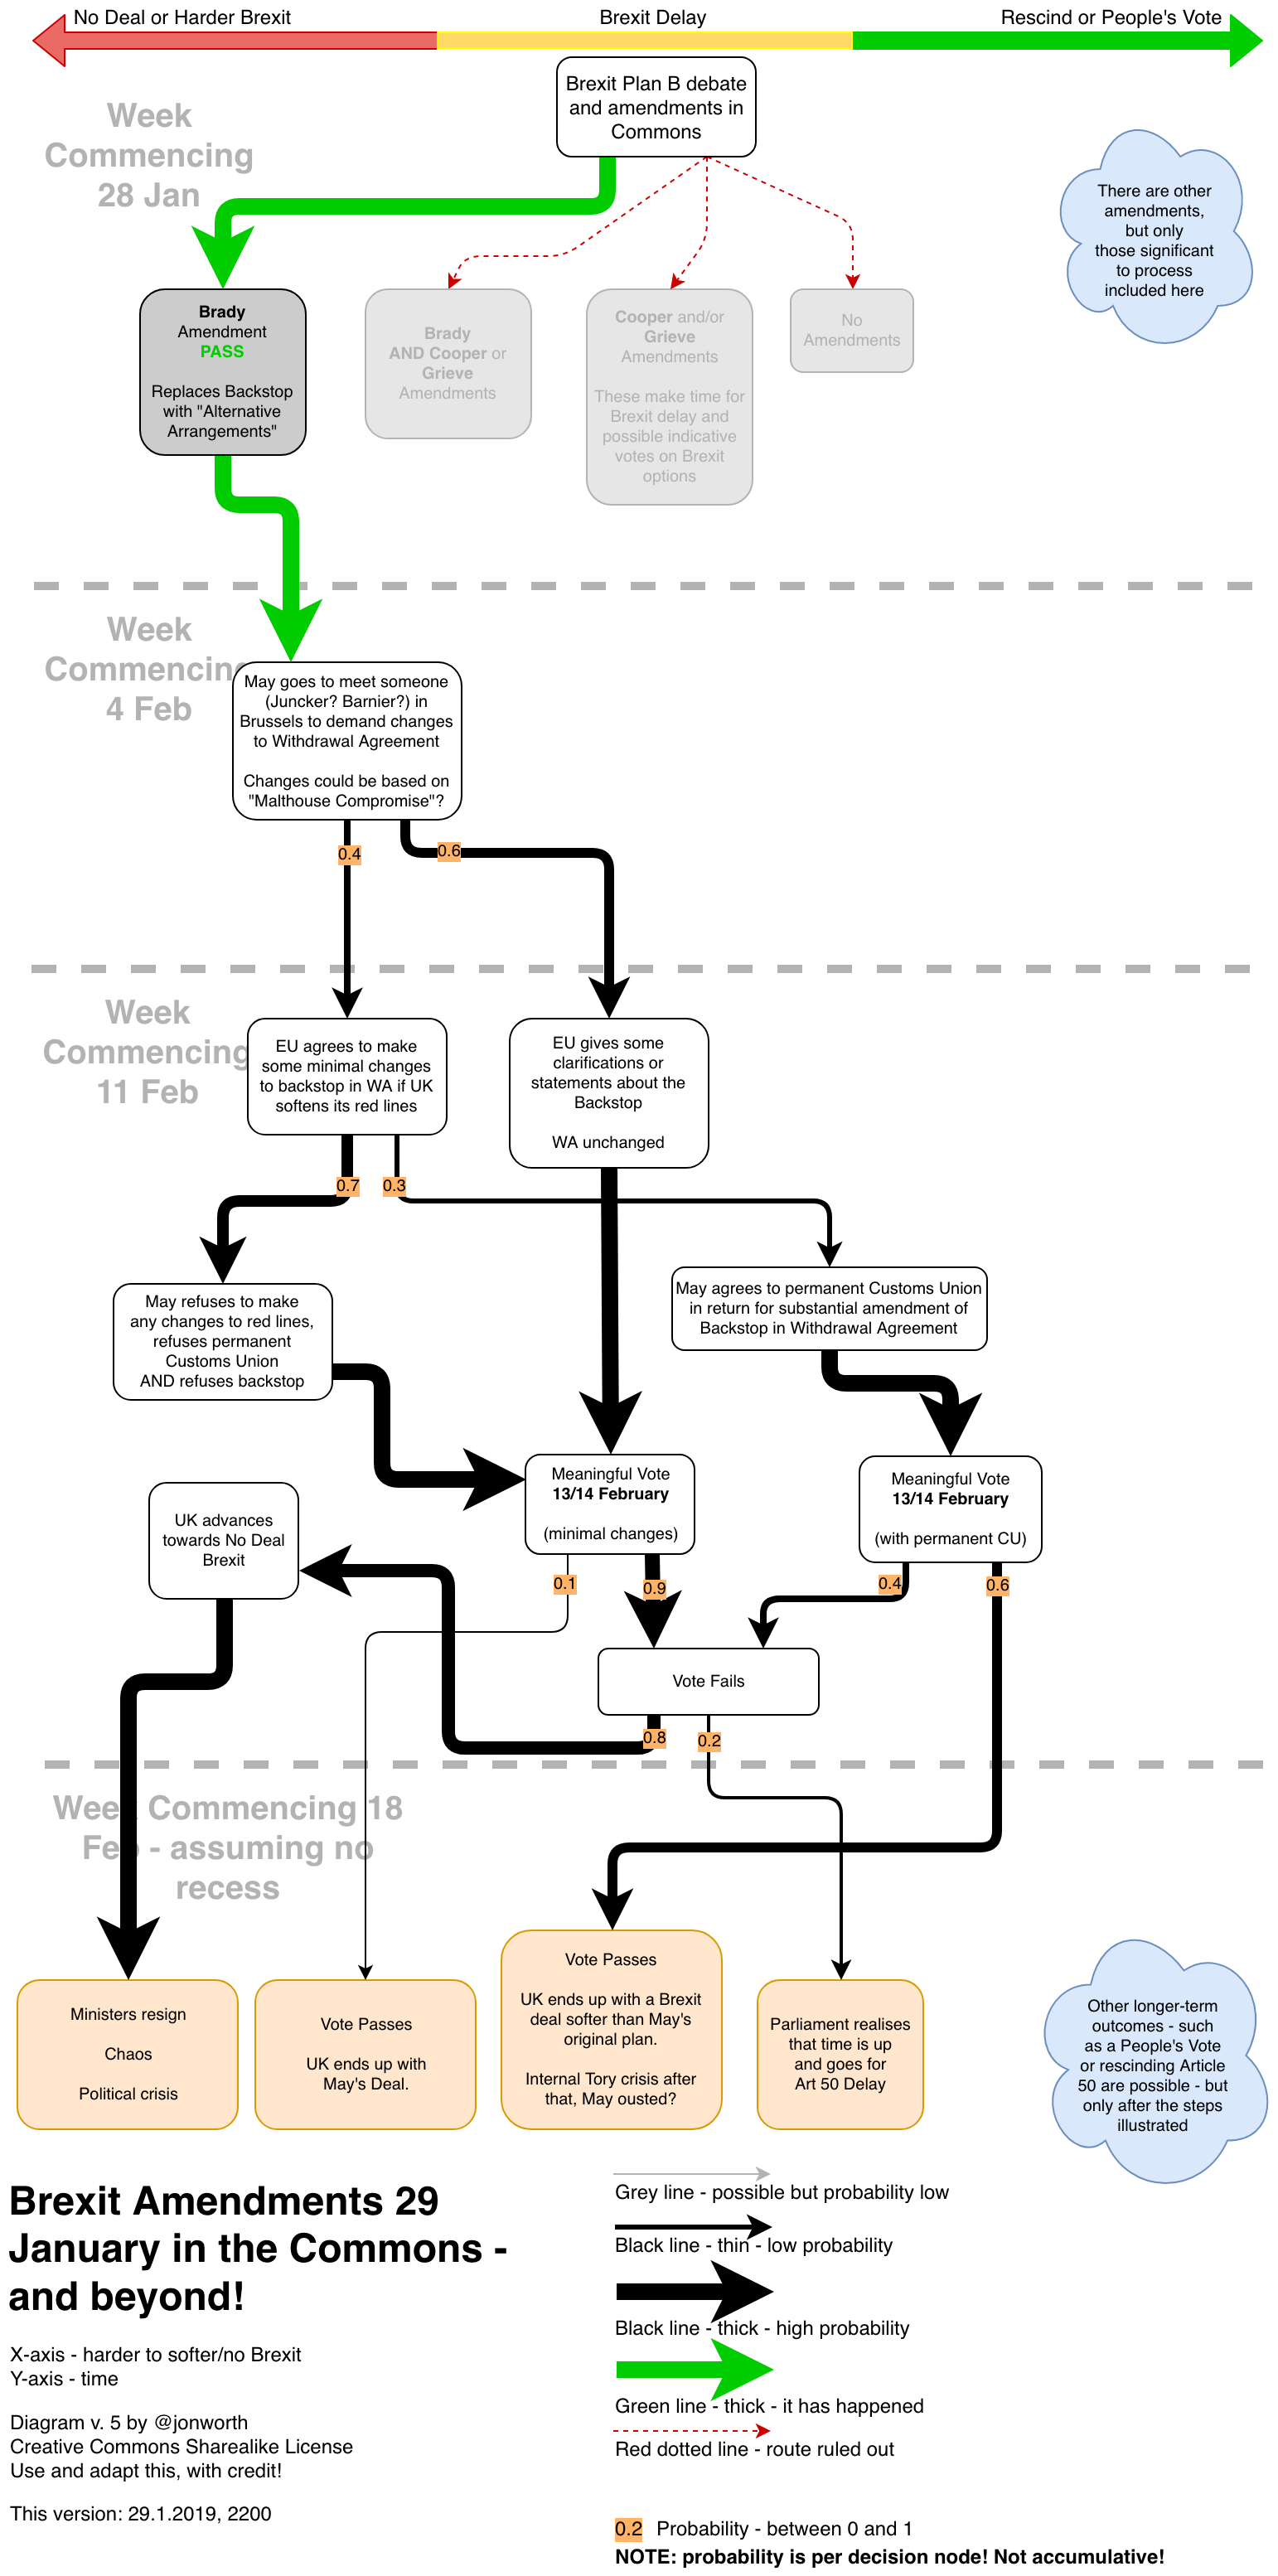
Version 5 – 29.1.2019, 2200
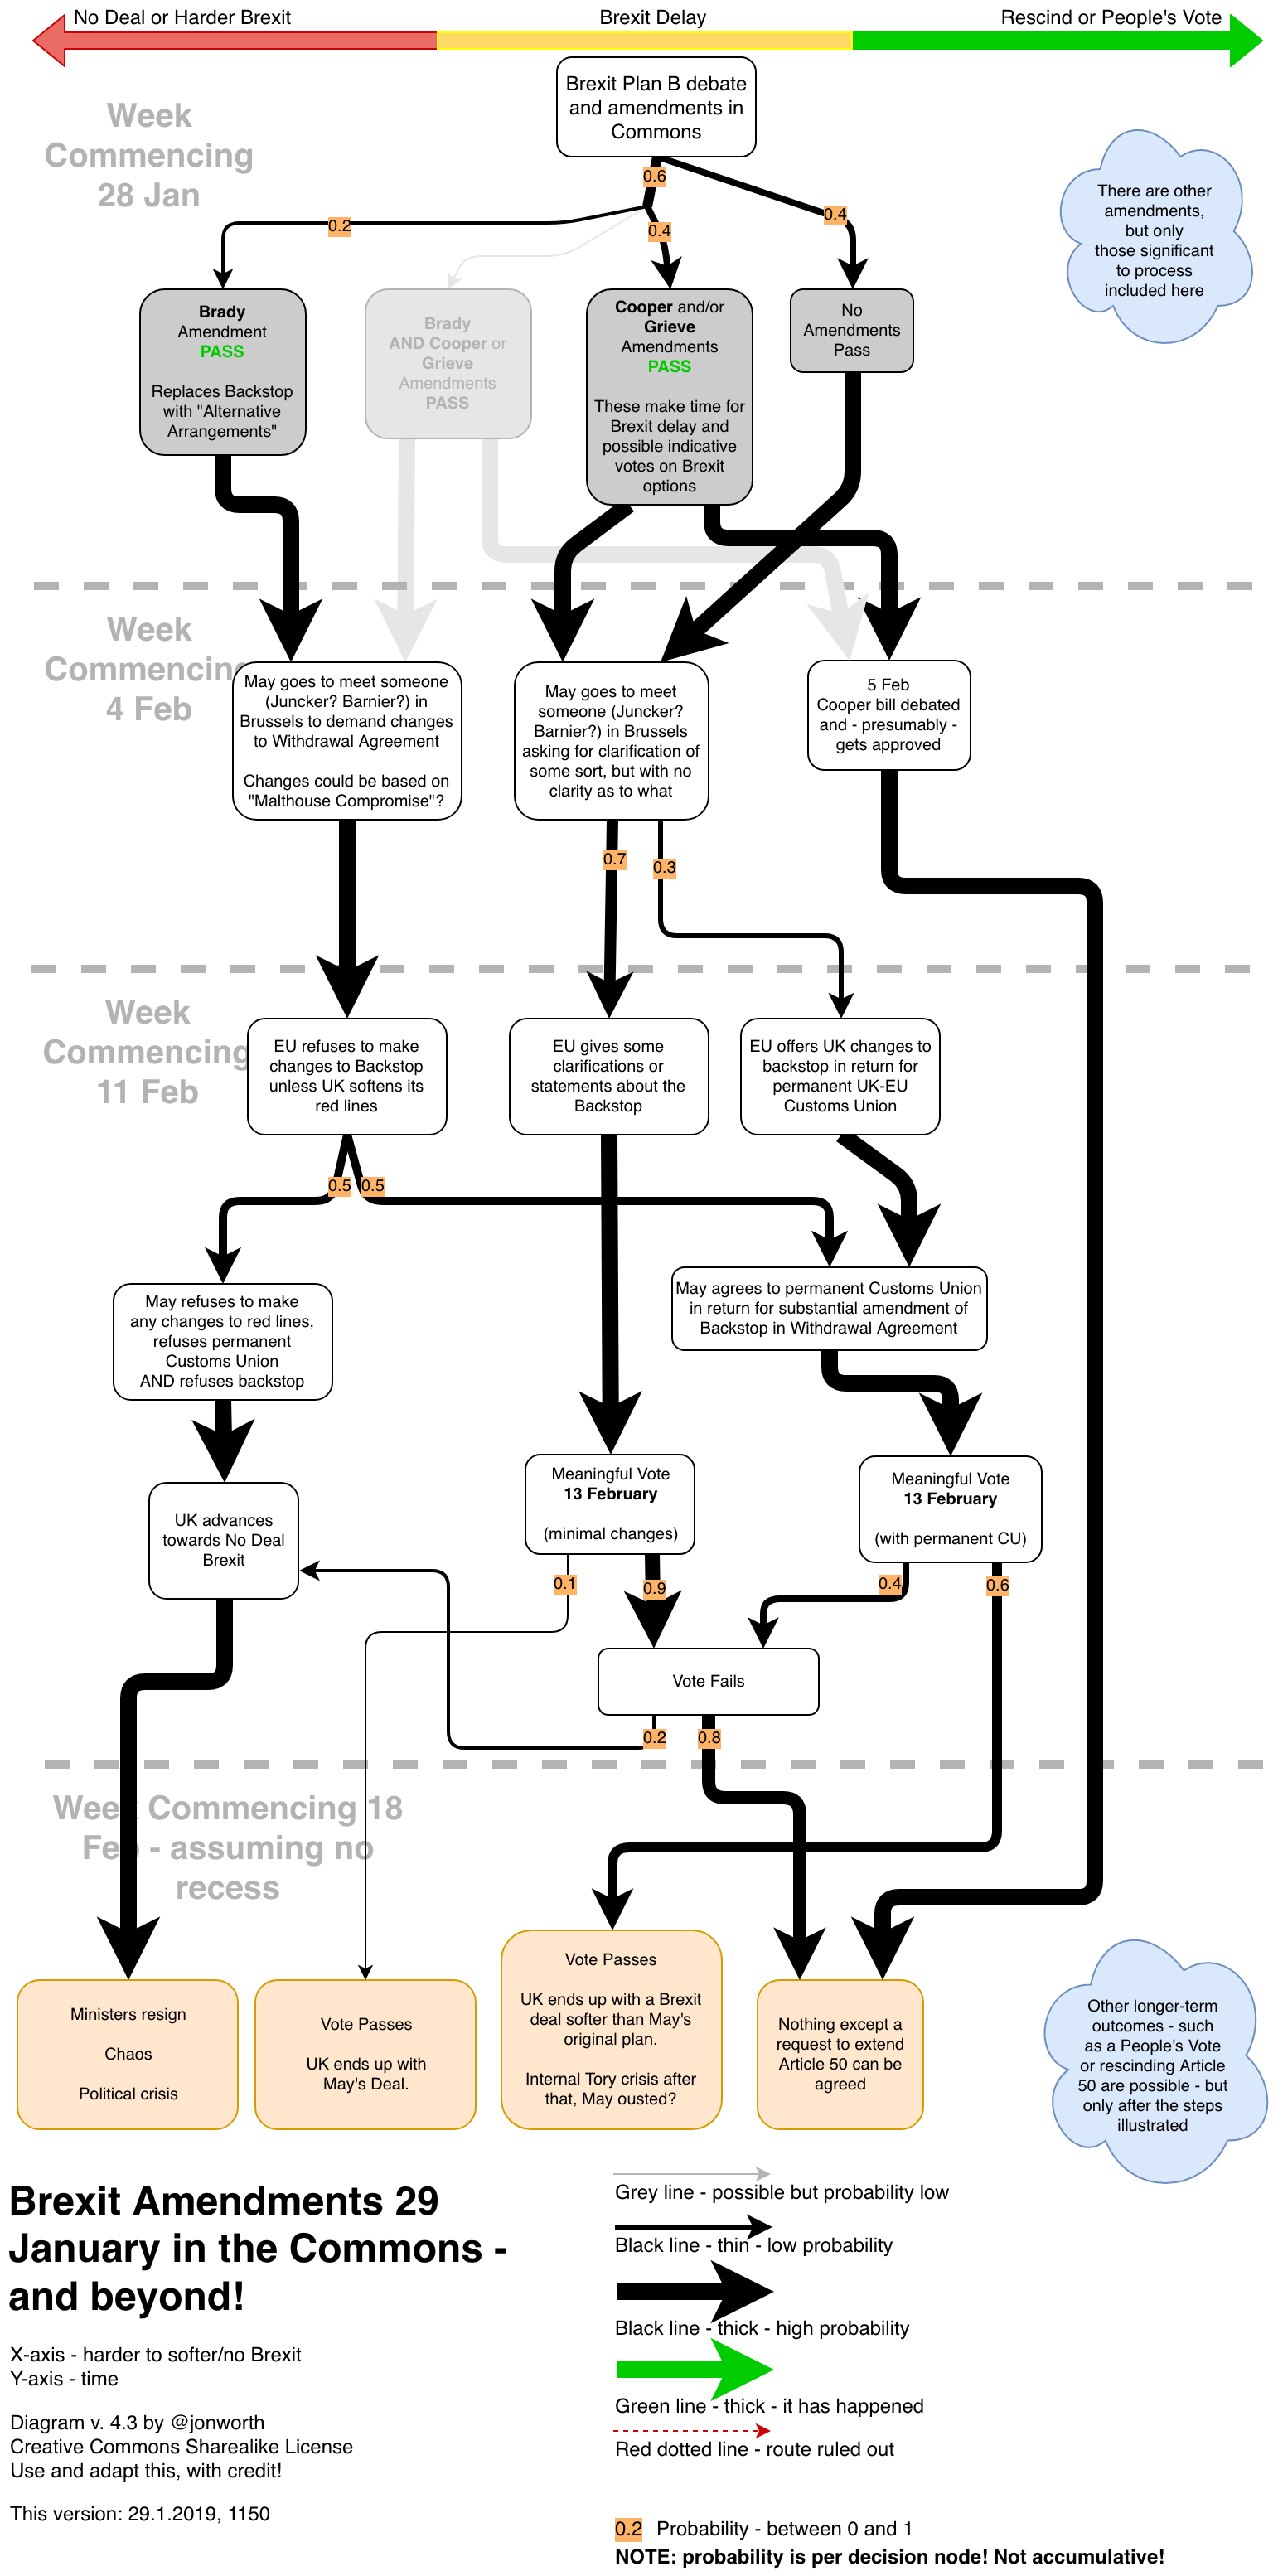
Version 4.3 – 29.1.2019, 1150
Version 3.2 – 27.1.2019, 2205

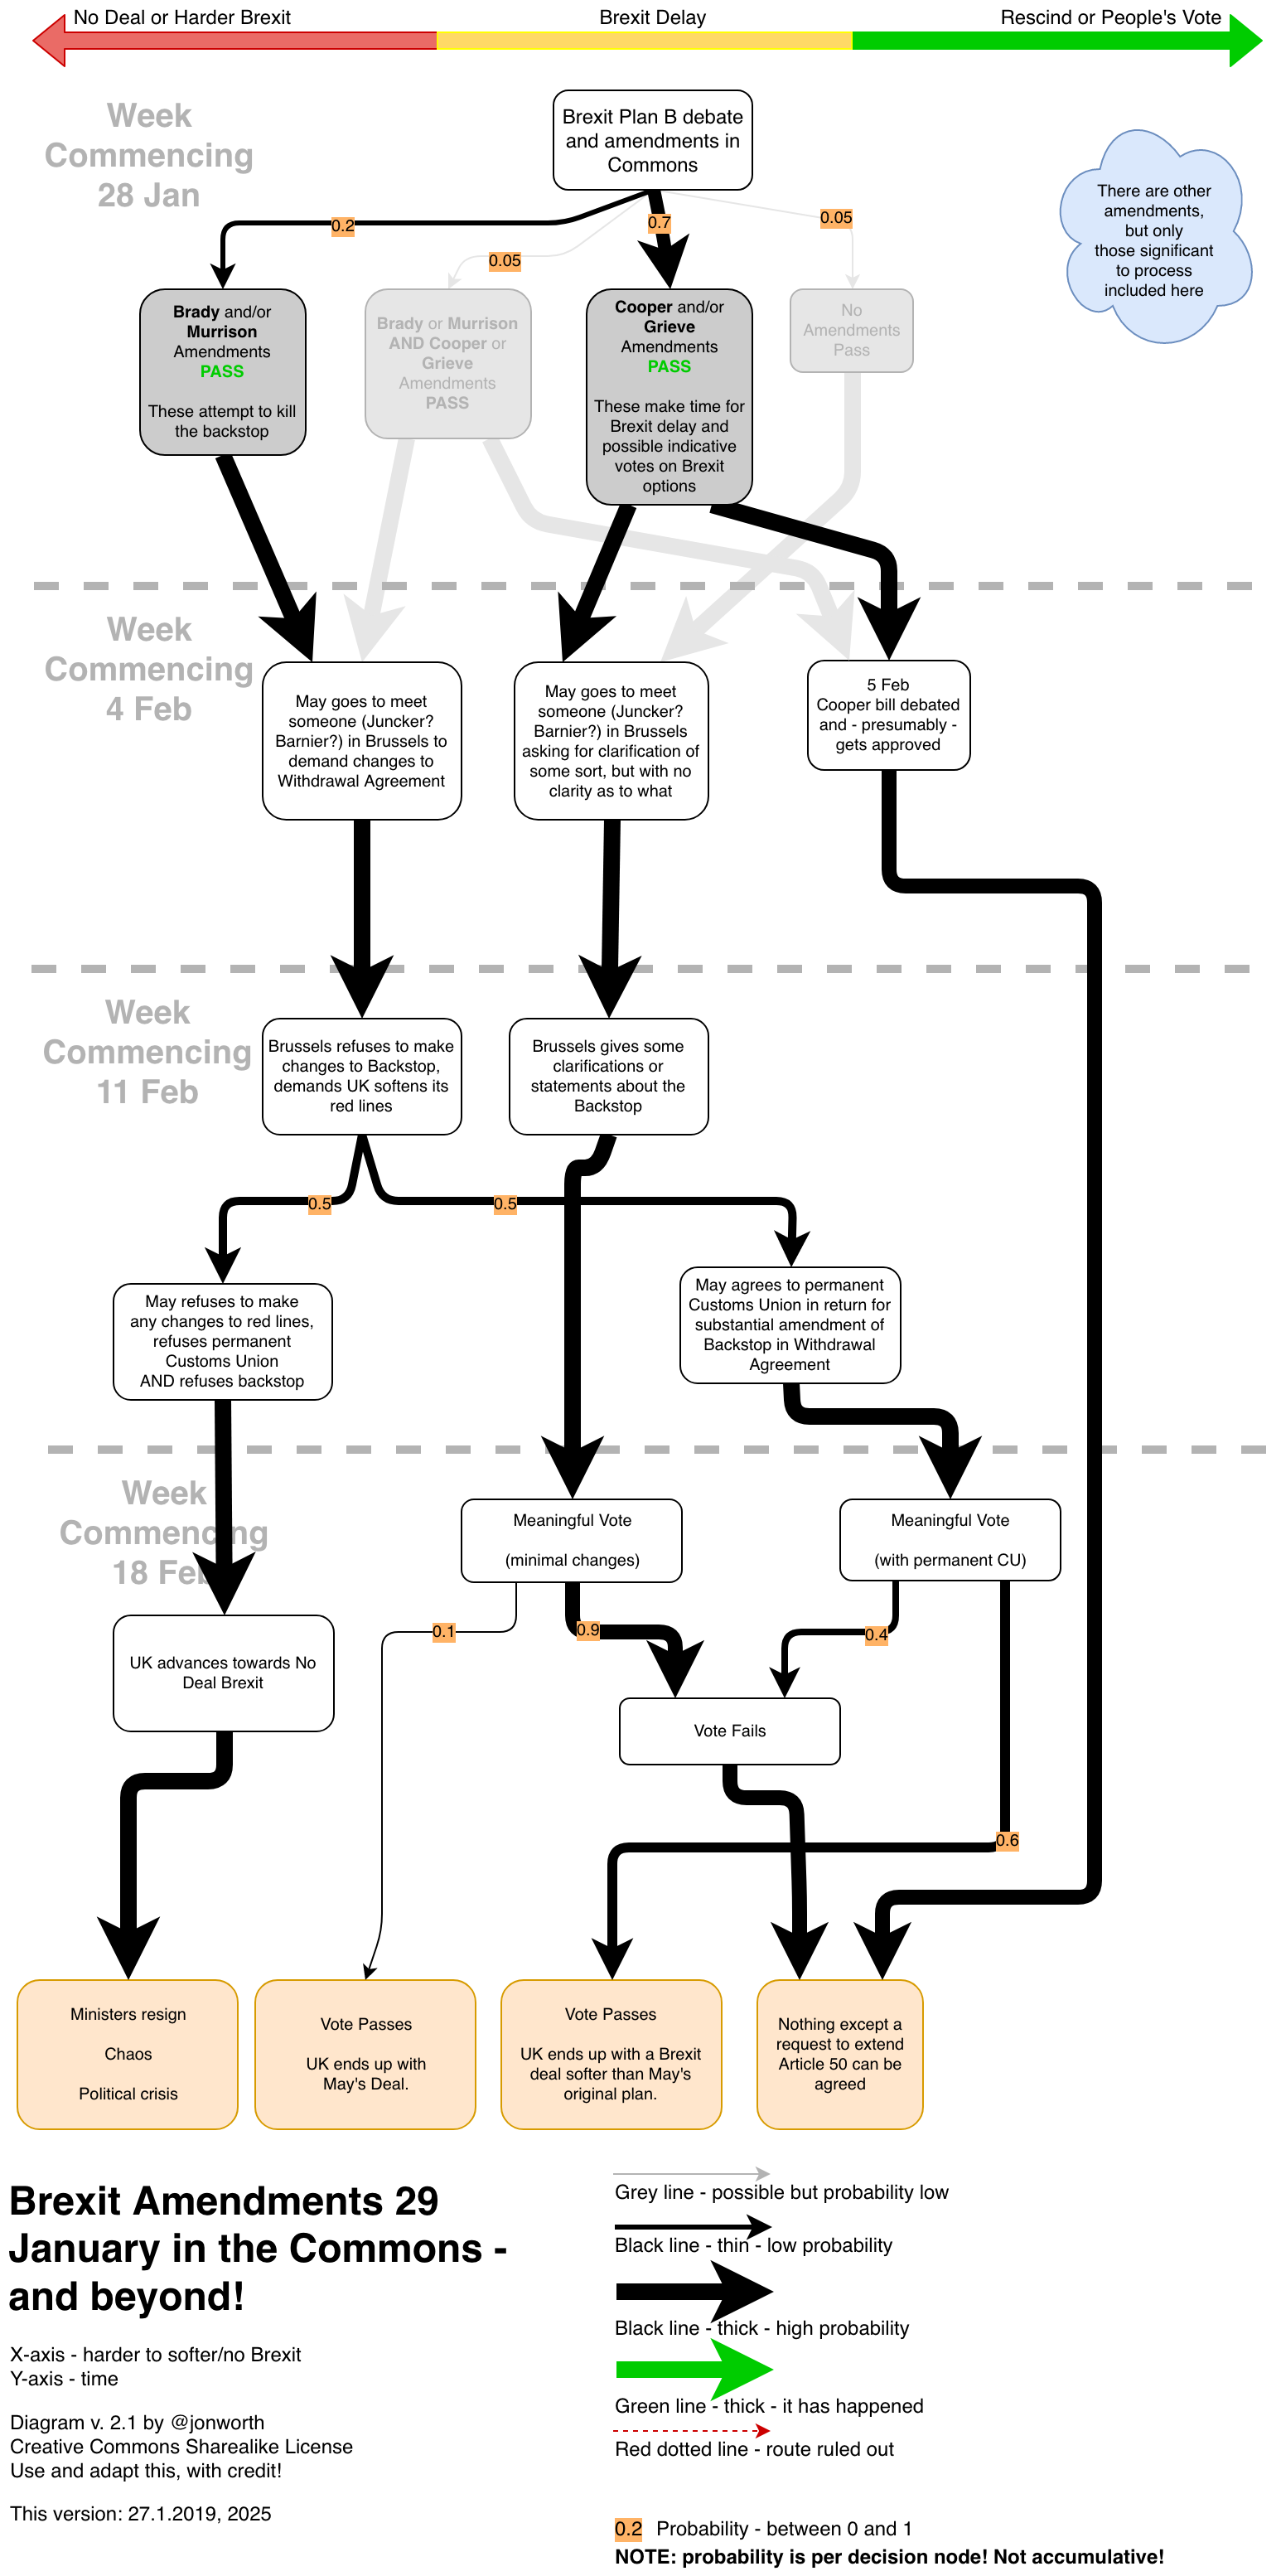
Version 2.1 – 27.1.2019, 2025
Version 1 – 27.1.2019
(this one really did not work! It needed a major rethink for version 2, above!)

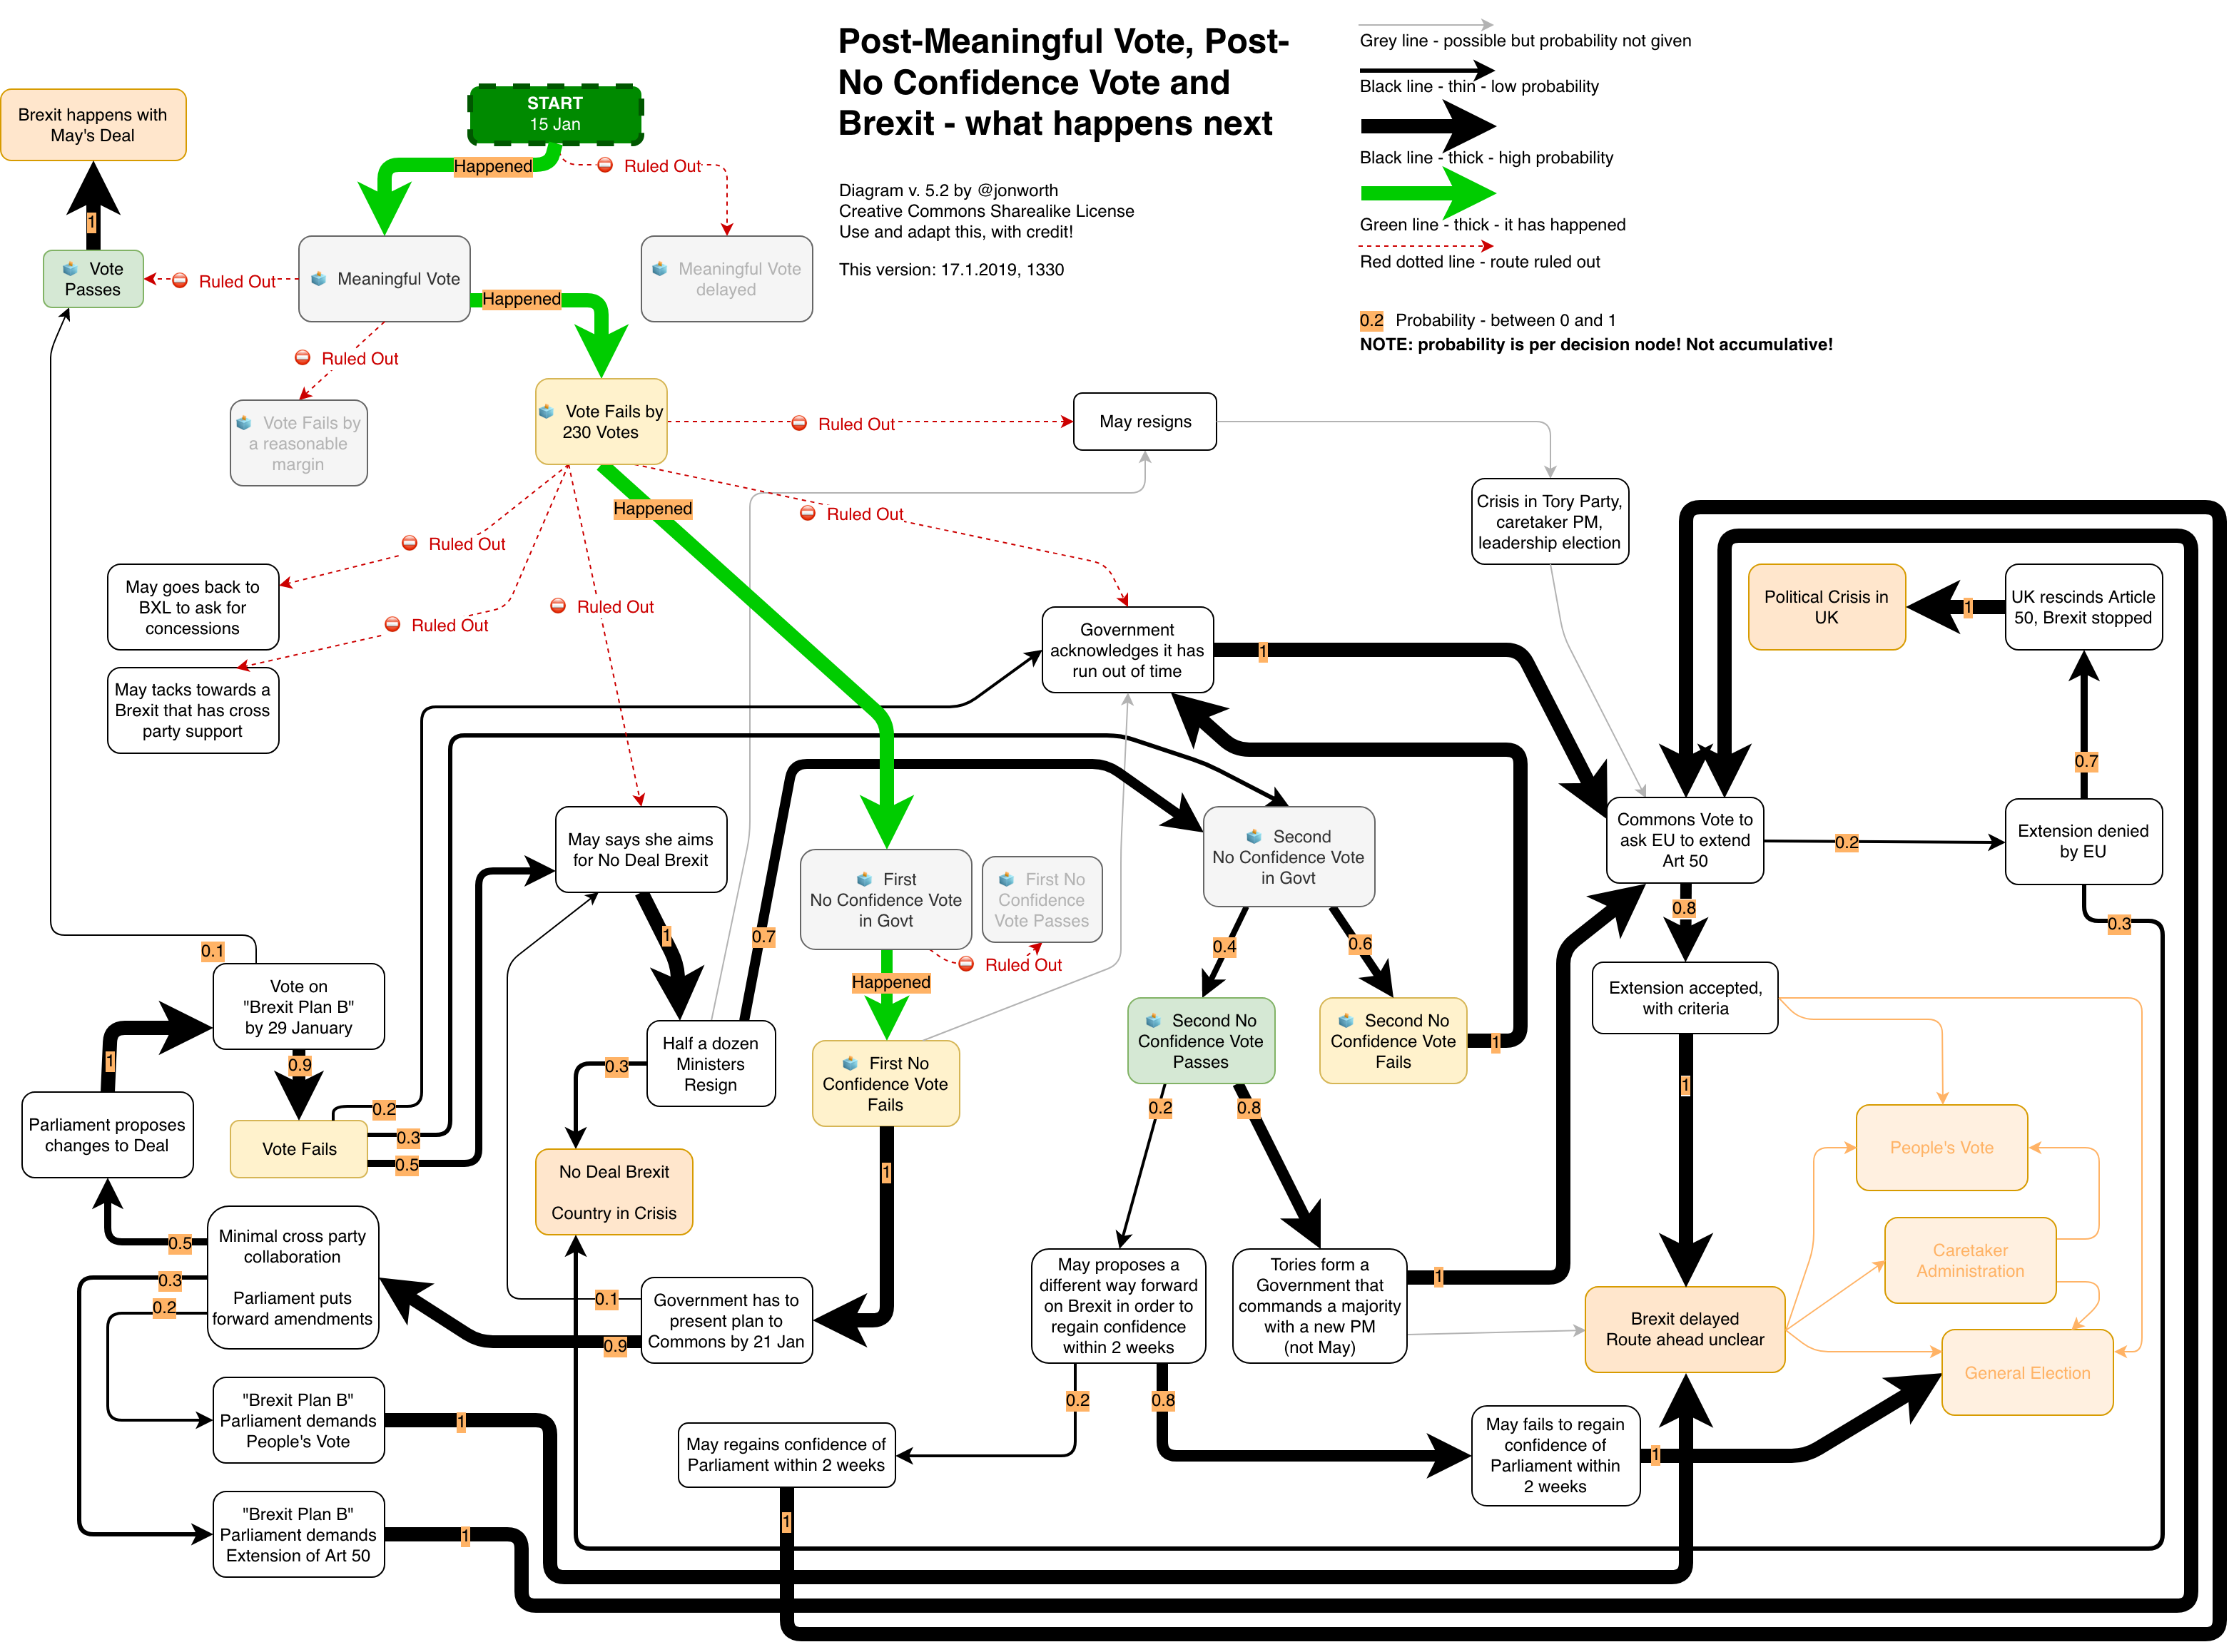
Version 5.2 – 17.1.2019, 1330
Version 5.1 – 17.1.2019, 1300

Version 5 – 16.1.2019, 2115

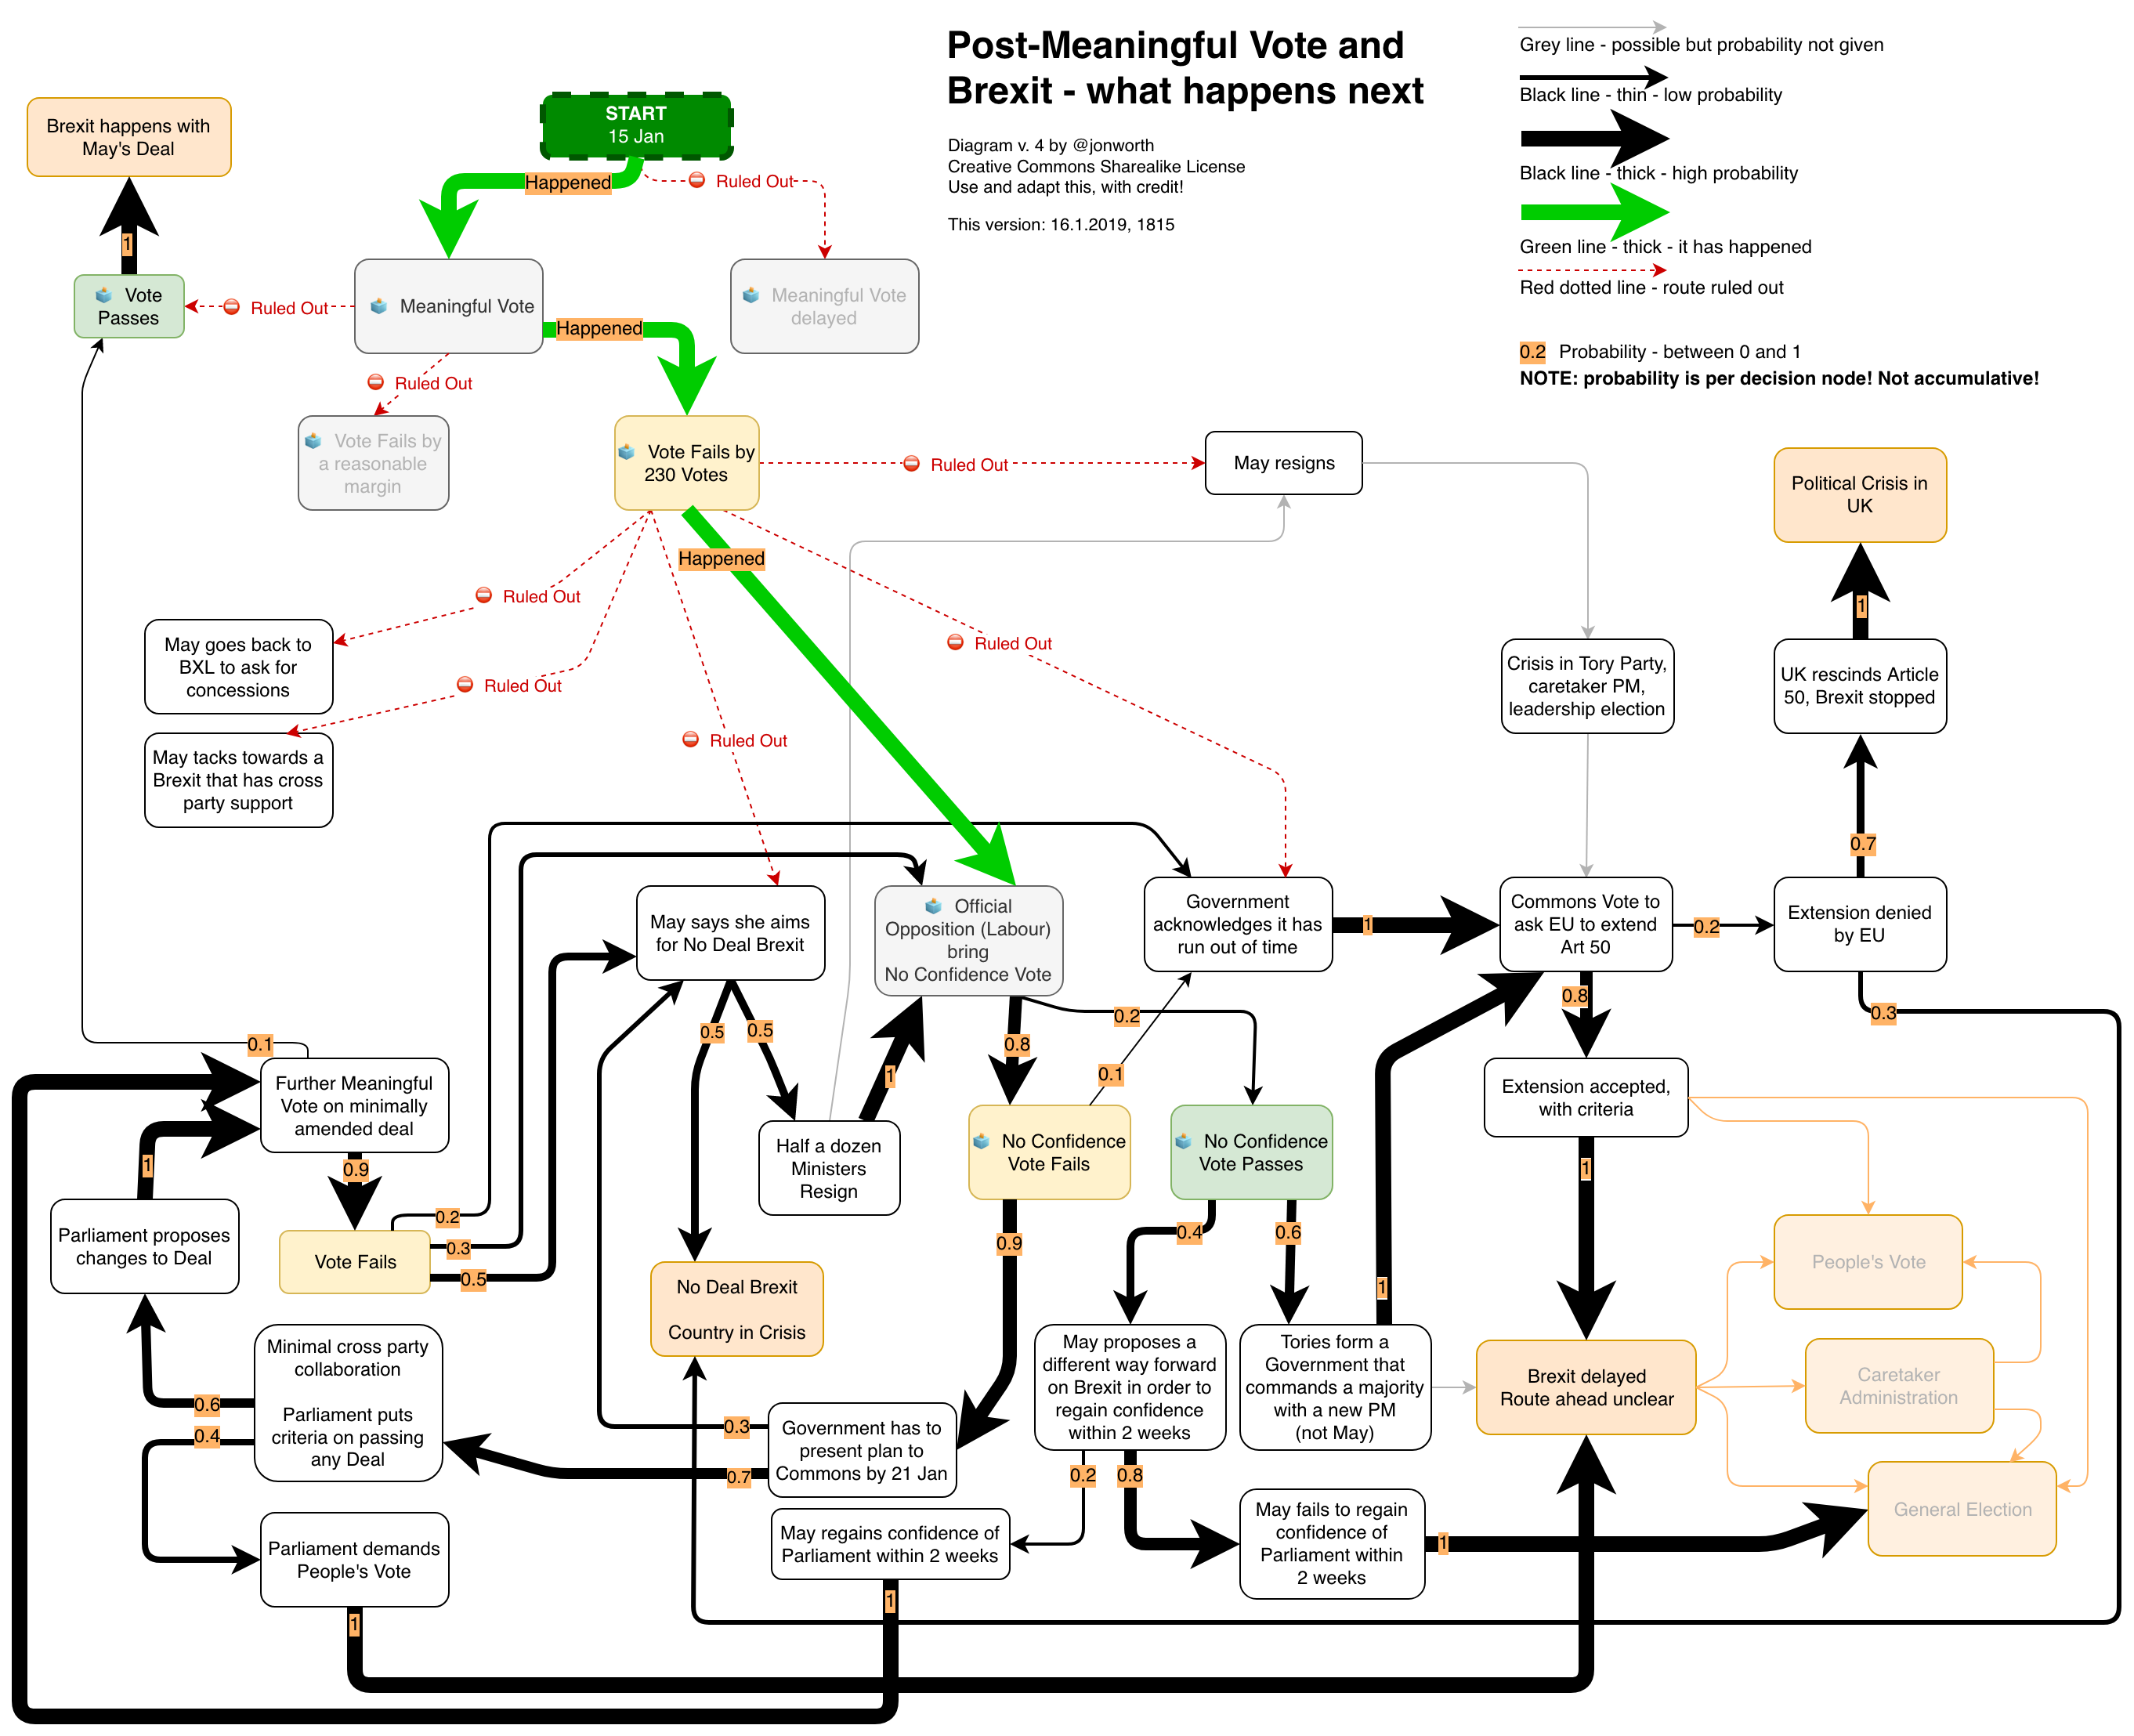
Version 4 – 16.1.2019, 1815
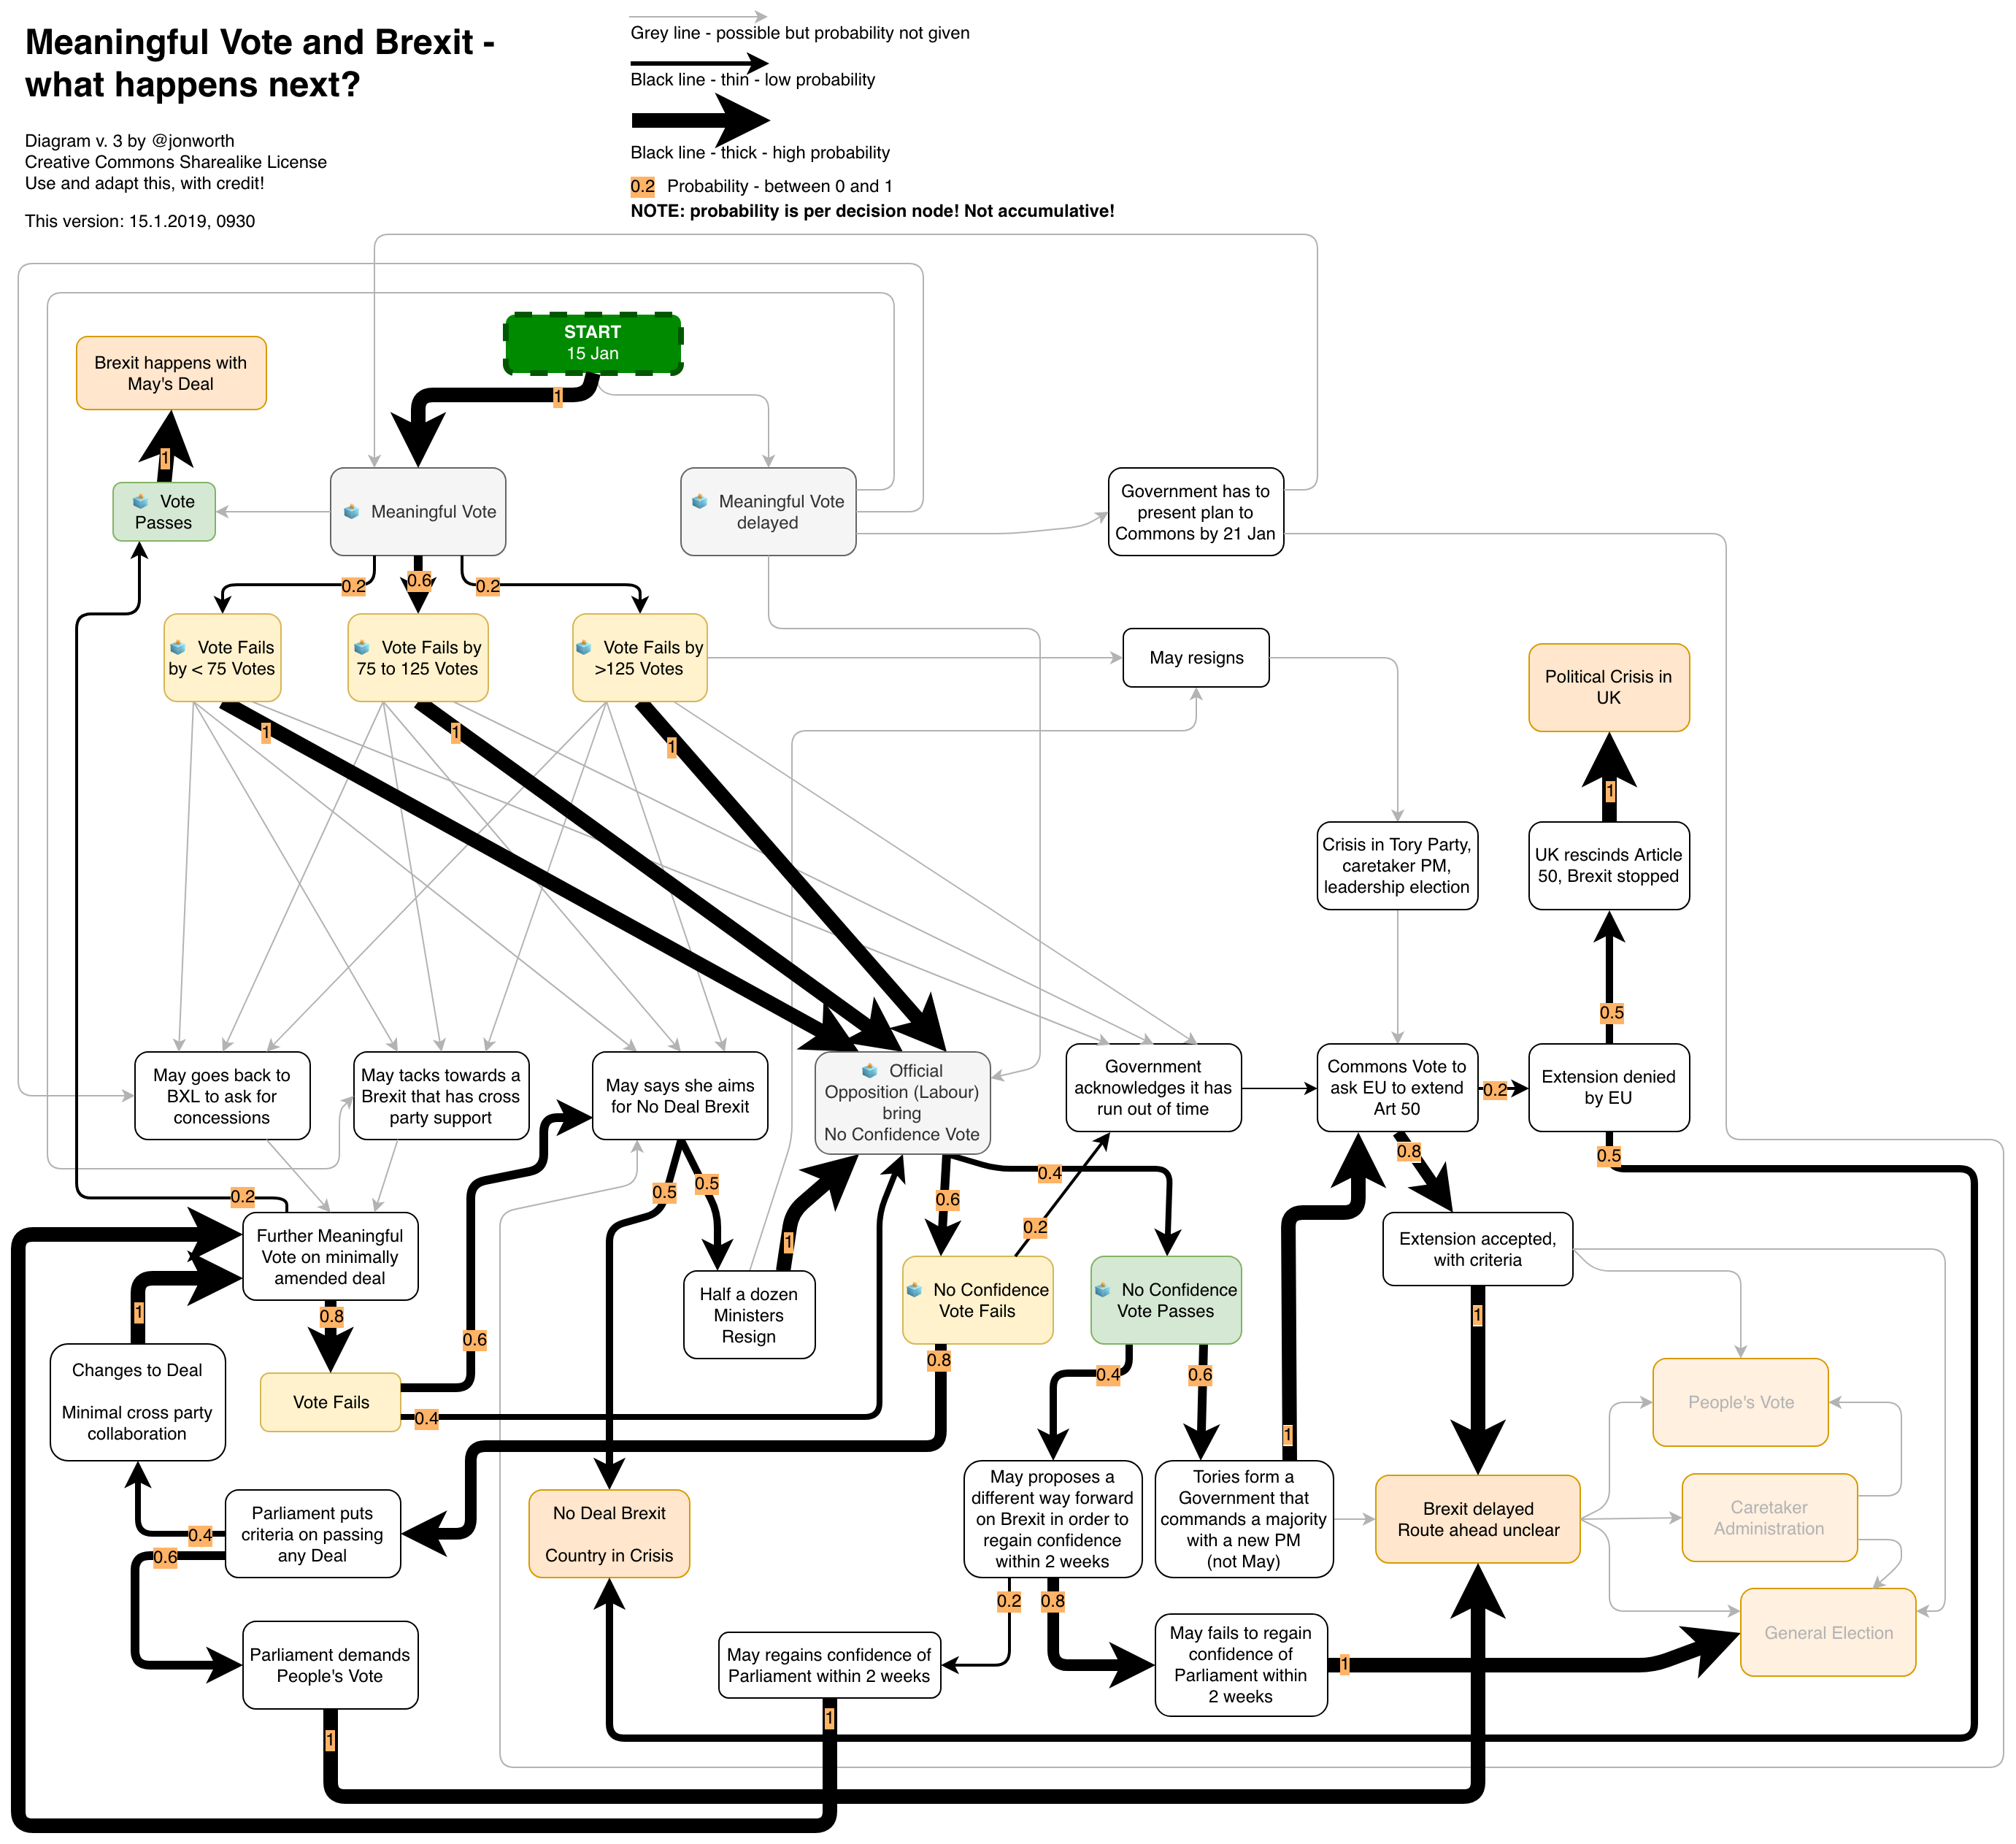
Version 3 – 16.1.2019, 0930
Version 2.1 – 13.1.2019, 1330
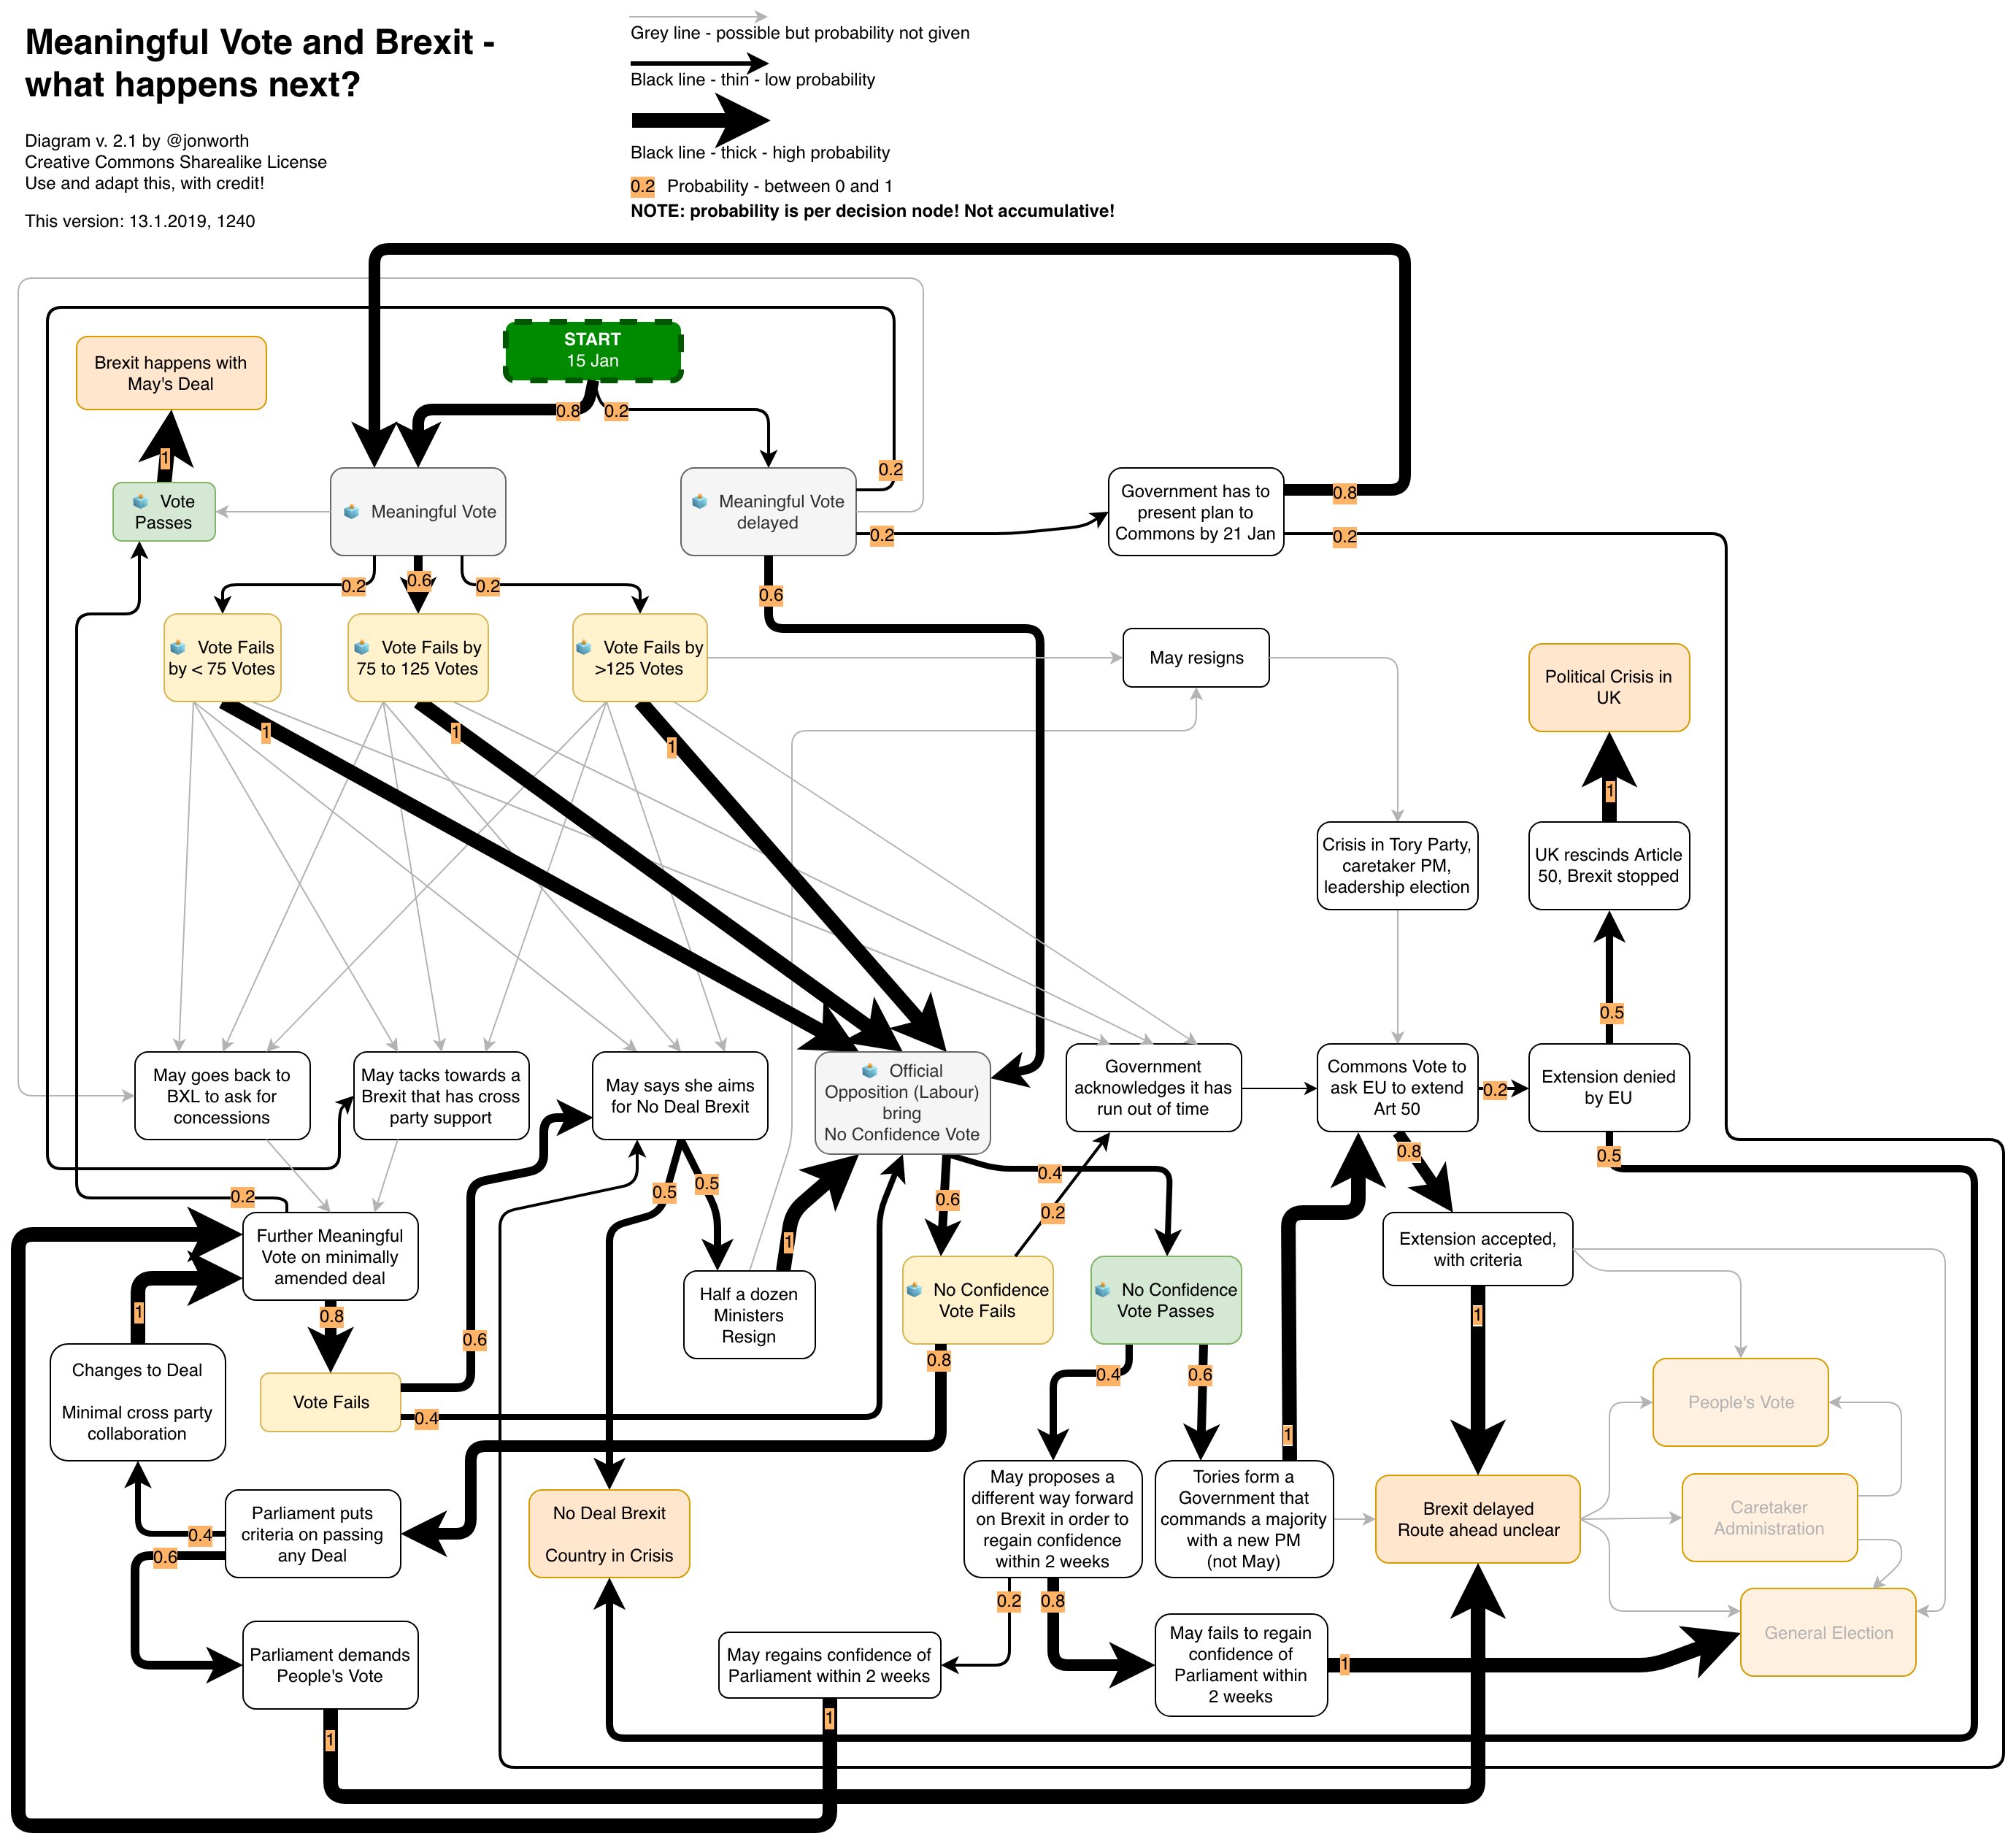
Version 2 – 13.1.2019, 1240

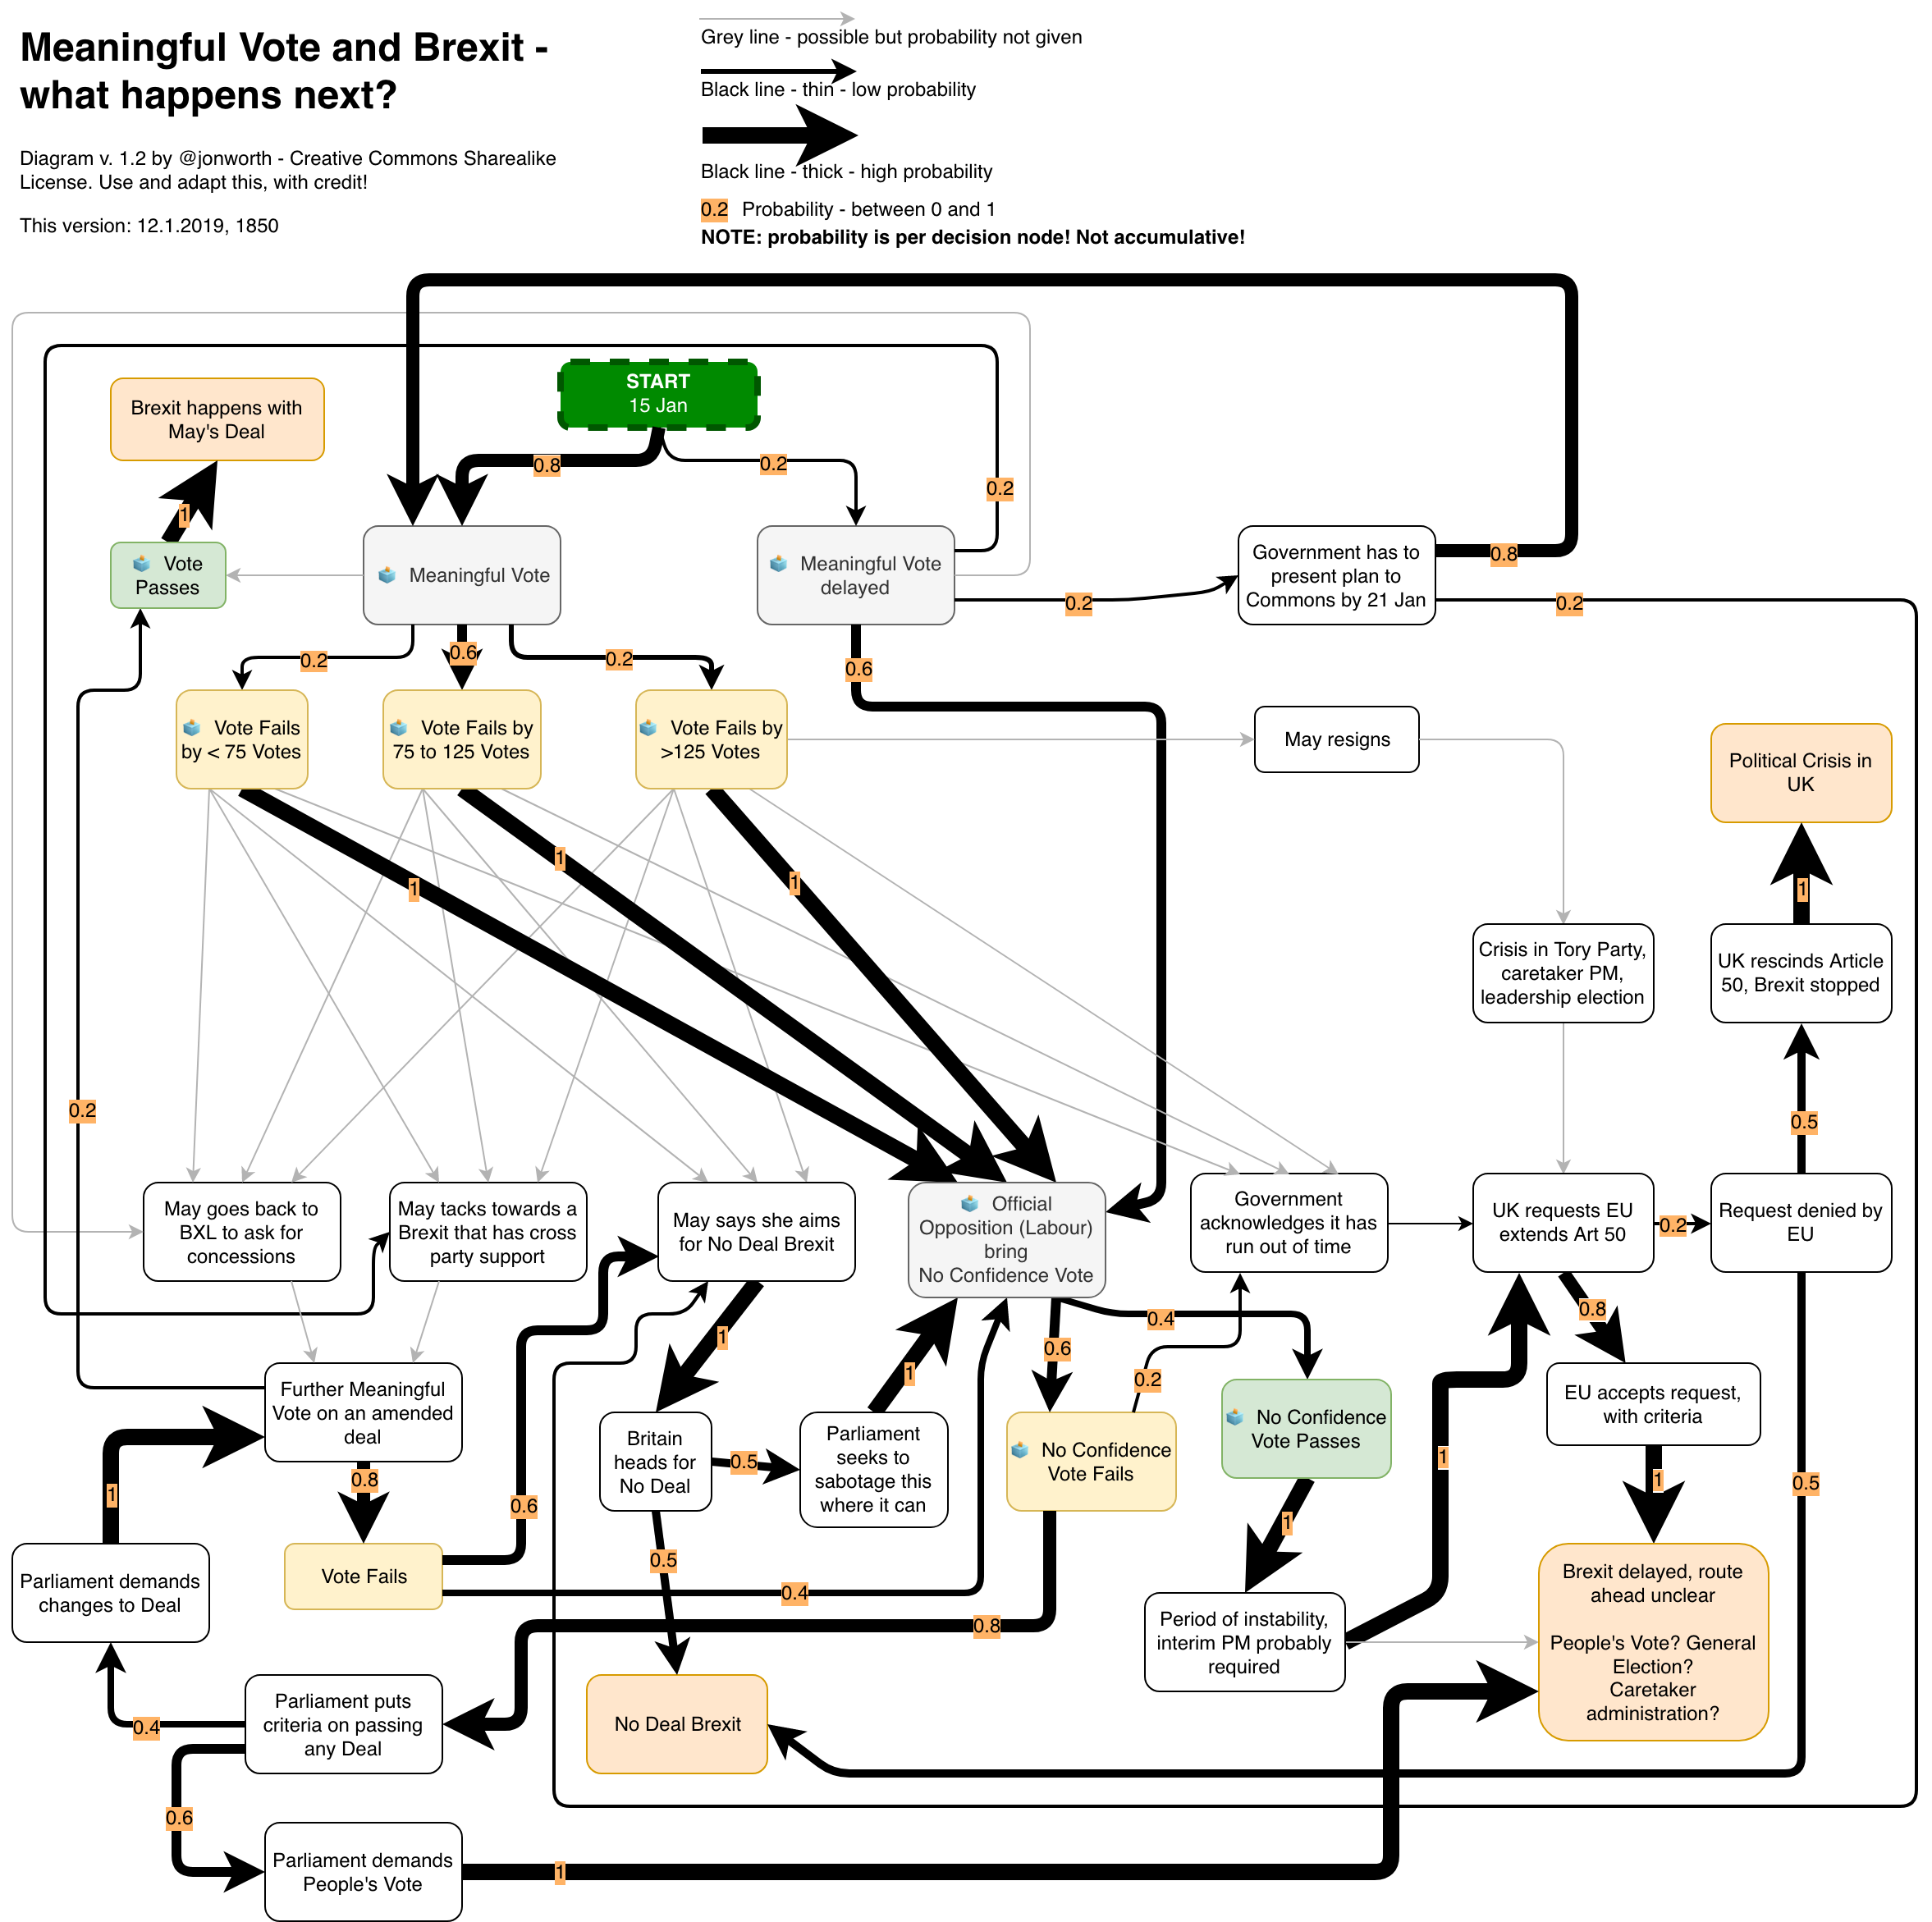
Version 1.2 – 12.1.2019, 1850
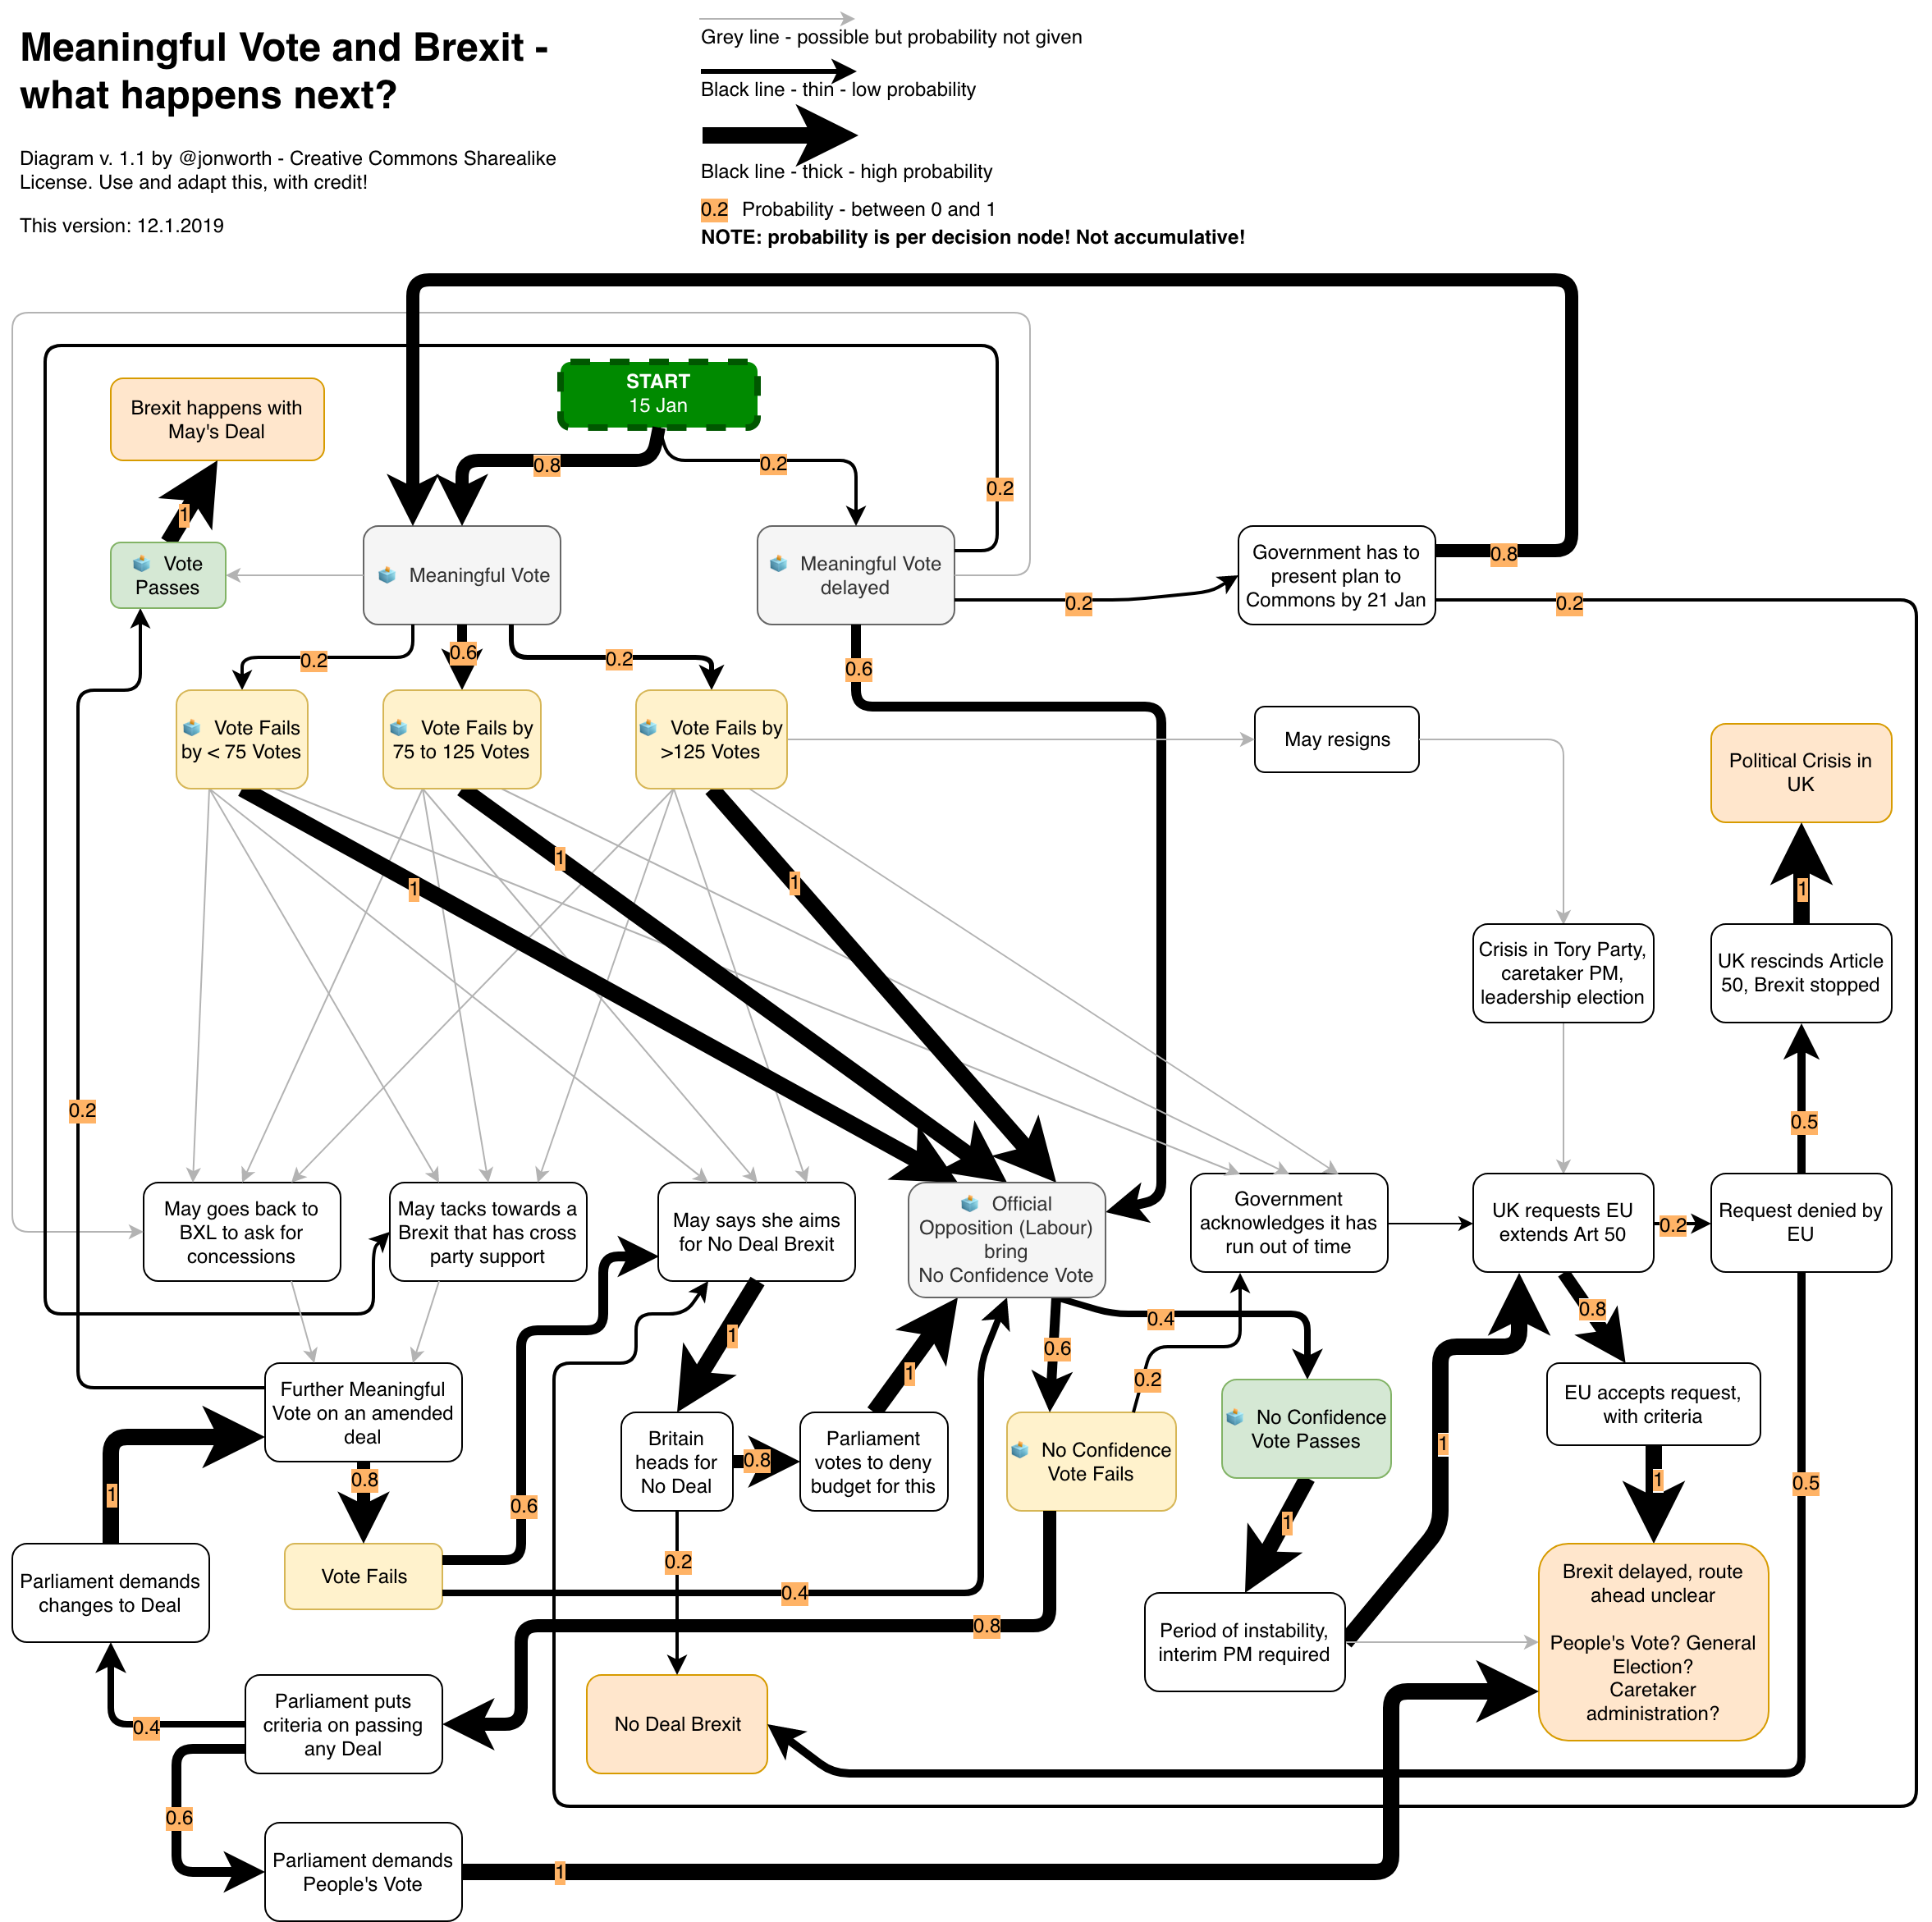
Version 1.1 – 12.1.2019, 1810
Version 1 – 12.1.2019, 1440
You can of course opt for the David Landon Cole simplified version!
I've produced a slightly simplified version that may be instructive. pic.twitter.com/4H7OJfOByf
— David Landon Cole (@dlandoncole) January 17, 2019


You are an Artist!
Re Version 23.
Thanks for an awesome and dedicated work Jon. I wish however that I can agree with you on the possible final outcome(s), probability wise. I have had some time last month to watch most of the Commons Brexit debates. At least from my American perspective, the debates were passionate, honest, and above all intelligent. I do nonetheless worry about my brother and his family in the UK amidst this chaos. I am afraid that the euro-philic minority are going to have the final say, and exact a destructive divorce at any cost.
I had a go at making a flow chart last night, but found yours just now – they are masterful! Well done, and thank you.
Last week, the EU offered a delayed Brexit to April/May. Does the delay need to be approved by someone, for example the House of Commons or the European Parliament, or has the delay already been fully approved by everyone who needs to approve it?
Hi Jon,
thanks again for your flow diagrams, but you are doing your math wrong again:
32+6+11+11+28+13=101…Again. Please take your time to calculate when you are doing these flow diagrams.
Greetings,
Frank.
Frank – please take your time to download the .ods files with the calculations in them before sniping on my blog. These are rounding errors, and the calculations are correct and do sum to 1.
I’m 99% sure he’s trolling you, but there’s still that 2% chance…
Re. version 22.
I’m not sure that indicative votes process needs to get to a consensus of a single option. If I were running this, I’d have separate votes (after a thorough debate!) on each possible option (including the current deal, no deal and remain), and use this to strip out the least popular options through getting some indication of the order of preference. Or a bubble sort, with two random options compared and the winner pushed up, and the loser pushed down, until they are in order of preference. BUT… in the end, there may be more than two possibilities that are tied, and as long as each is technically possible/ allowed by EU we would have a three-way split that could be put to an informed referendum.
Common Market 2.0, rescind and ‘customs union’, for example, could then be put put to the people as a preference vote. This is THE referendum. If we use the ‘buying a house’ analogy, the 2016 vote was the ‘offer referendum’, as in ‘We are interested in leaving the EU, what terms can we get?’, and we need to eventually have the ‘contract referendum’, so ‘Now we’ve looked at the Ts&Cs, and checked the paperwork, this is the version of Leave we want/ actually it’s probably not worth it’.
Cool graphs — I think one key set of probabilities of out of whack though:
1. There has to be at least some probability (IMHO 50%+) that Bercow rolls over and permits MV3 next week, whether or not it has a particular amendment attached.
2. OR, some nonzero probability that MPs can be persuaded to specifically permit MV3 (overriding the procedural regulation blocking it)
So in summary there should surely be some reasonable chance that they end up voting on MV3 unamended (with a child node representing amended / unamended I suppose). Similarly you might want to include the Nandy amendment, which was touted as perhaps winning some Labour support, and so would have child paths that lean maybe 25% towards May’s-deal-passes. Of course any of the May’s-deal-passes paths are still quite unlikely, so the end results aren’t perturbed that much by such an alteration.
Great!!!
When the next update?
Hi Jon,
in your last post the amount of percentages adds up to 101/%. 15+40+?+25+4+17.
Just wanted to let you know.
Greetings,
Frank.
Thanks! Corrected in the new one.
First of all I think your flowcharts are amazing, thanks for creating them.
I do have some issues with the 40% probability for a general election with a 3 month delay. A general election would, I imagine, require a longer delay. Three months gives barely any time for a future UK government to renogitate with the EU and get a new agreement passed in parliament.
Fascinating visualization! Is there any particular reason why you didn’t put cumulative probabilities to the final scenarios (i.e., the orange boxes)? Of course, one could do the math based on all the branch probabilities already, but why force the lazy reader to do it. Great work already, of course.
Hmm, interesting that your pinball machine gives the counterintuitive outcome that if May plays well in Brussels, the probability of No Deal actually increases. Counterintuitive, at least for me.
Version 7 of 15 February still shows the old 4 Feb image?
Thanks for all these, Jon!
Or rather, the images of versions 6 and 7 should be swapped.
Seems fixed now. Thanks!
By the way, the embedded Twitter feed on this blog has not updated for a month.
Hi Jon
I came across your latest blog post via Twitter and shared the link of this post into a comment on Jason J Hunter’s Facebook page (former international trade negotiator who has appeared on BBC news multiple times discussing the dangers of Brexit) because I think he and his followers would find it useful. Immediately on posting this comment, I received an alert from Facebook stating that my comment goes against Community Standards and my post is not visible to anyone. I have requested a review from Facebook. Any ideas on why they will not allow me to post your blog??? It feels suspicious! Cheers, Charlotte
(p.s. my post simply read, “Jon Worth has created this comprehensive flow chart of all possible Brexit paths. Worth a look. LINK”
Dear Charlotte – thanks for the comment, and that is rather odd! I cannot think of any reason why that would happen, and have indeed posted these diagrams to Facebook myself. Could you maybe download one of the high res images and then post that?